China: Investing in real estate (foreigners), house price development, taxes & economic forecast 2025
Real Estate & Economy in China – Real estate prices, gross domestic product, population, purchasing power and business forms in China. A current picture and forecasts for 2025. China’s house price index is rising and rising. In the last 5 years across the country by an average of 9.9 points (that’s 9.9%), and in Mega Cities like Beijing by as much as 47.2 points. Today I published a new guide on my social media agency, on the topic: marketing in China. We’ve covered real estate and investing in the US quite a bit, as well as foreign real estate in France, Italy & Co. Today we want to talk about China! China is the second largest economy in the world, after the USA. The country’s economy has been growing for decades, real estate is subject to lower fluctuations, it is worth taking a look at China. China is on the rise.
Real Estate, Investment and Economy in China
First of all, the most important question, how is the real estate market doing? The good news first: very good. Example: In Beijing, the capital, purchase prices (by house price index) increased by 47.2 points (+ 47.2%). A good real estate return. In comparison, in Germany the house price index rose by 32.3 points in the same period. China is making further leaps forward.
Just buy it? Of course you can’t. Who would have thought, only Chinese citizens are allowed to own real estate in China. And yes, only Chinese citizens are allowed to own real estate in China, as you will learn later in the section on business models and taxes.
As a small analysis, with a look back at the past years, we wanted to summarize the most important figures, around the economy, population, age structure and also real estate price development. Because… The USA has it as the largest national economy perhaps, soon replaced. With its million mega cities like Chongqing, Shanghai, Beijing, Guangzhou, Shenzhen, Wuhan and Tianjin. Here are the latest figures from the IMF:
| 2020* | 2021* | 2022* | |
| USA | 20.807,27 | 21.921,59 | 22.967,65 |
| China | 14.860,78 | 16.492,81 | 17.933,63 |
| Germany | 3.780,55 | 4.318,49 | 4.556,81 |
If you want to invest money abroad, or even set up a company/branch locally and live here, you are looking for one thing above all else:
Plant Safety
Markets are subject to fluctuations, the more extreme these fluctuations are, the higher the risk to capital. Whereas 10 years ago the real estate market was still making great leaps upwards, but at the same time also downwards, the trends are increasingly stabilising, the extremes are becoming smaller. Accordingly, first a look at the Chinese real estate industry and the development of purchase prices.
House price in China: View of Beijing
House prices in Beijing, China – You are looking at the residential price index provided by the National Bureau of Statistics of China (NBSC). The NBSC data goes back to January 2011, and prices have been rising every year since 2015, for residential buildings, but also for land.
What does the house price index say?
House prices have risen steadily in recent years in almost all provinces. This is shown by the house price index available here from the NBSC, which, starting from the year 2015 (index = 100), stood at about 47.2 points in 2020. Thus, compared to the base year 2015, prices have increased by 47.2 percent.
Of course, the capital Beijing is the hotspot for foreign investors. As you can see right now compared to the country as a whole, with an increase of
This is attracting more and more interest from investors from Europe, USA, UAE and all over Asia to China.
Source: Global Property Guide
Land prices: Price index for China
This statistic comes from the Bank for International Settlements (Real Residential Property Prices for China [QCNR628BIS]). The basis here is 2016, which means that prices have increased by around 9.9 points since 2016.
Comparison: China / Germany: House price development
Now many will ask themselves, how is the development in Germany? Is it worth investing in real estate? Here you can see the development of house prices in Germany in the years from 2000 to 2019 (2015 = Index 100); as well as the previous statistics on housing in Beijing.
China 2015 / 2019 Development:
- 48.1 points (+)
Germany 2015 / 2019 Development:
- 28.1 points (+)
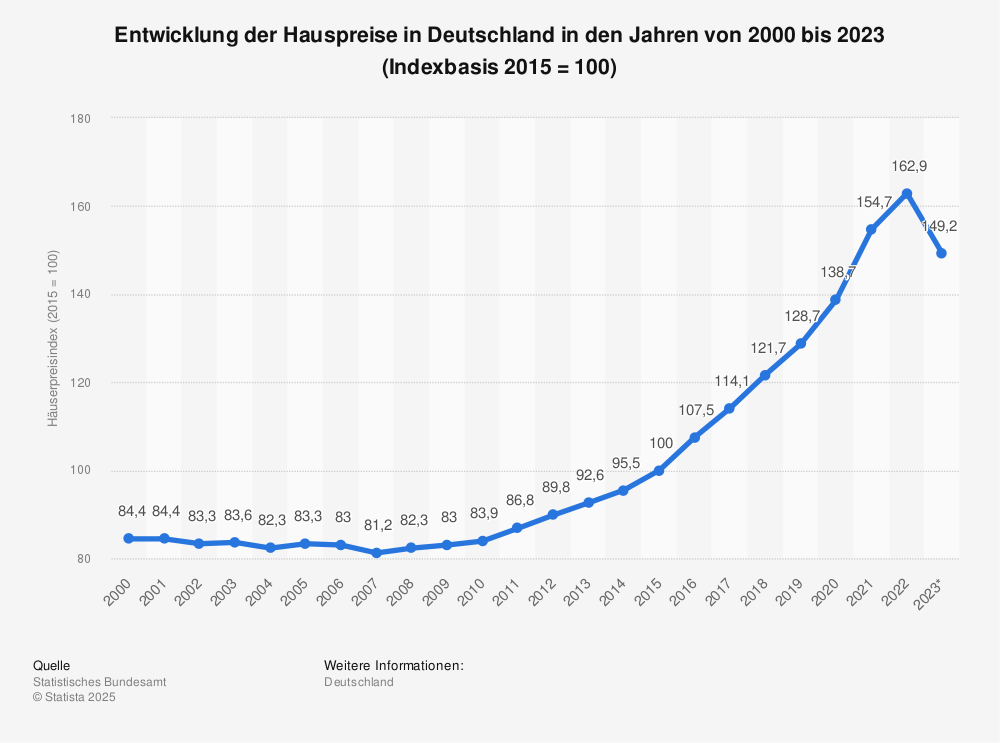
Property prices stabilise: 10-year analysis
Source: CEIC Data
Just like the Chinese economy, the real estate market is also stabilizing. The extremes of fluctuation are becoming smaller. So China, regardless of politics, is becoming an increasingly stable market, also for investors who want to invest money for the long term. The risks are declining.
China is building and building.
In summary – China’s real estate market in the last 5 years? The overall price index rose by 9.9 points, in mega cities like Beijing even by 47.2 points. With that, let’s take a look at the economy, gross domestic product and purchasing power in China. After that you will learn about the different types of companies in China.
Economy in China: GDP and purchasing power
Source: Socialmediaone.de(Marketing China)
Below is a quick look at China’s economy. More detailed analysis can be found in the source link. This infographic is interesting because 10 years ago everyone thought China would overtake the US in 2014. As we know today, a miscalculation. The US is still ahead of China!
Currently, the American economy is doing splendidly, especially after the US president cut many US taxes.
By 2025, the US, as an economy, will also remain ahead of China. According to the current IMF forecast, seen here, based on purchasing power-adjusted gross domestic product (GDP), in the years 2019 to 2021 (in billions of US dollars).
Source: Statista.
Growth forecast (IMF): 2025
| 2023* | 2024* | 2025* | |
| USA | 23.913,12 | 24.833,76 | 25.783,44 |
| China | 19.512,74 | 21.217,57 | 23.029,81 |
| Japan | 5.626,63 | 5.848,65 | 6.014,28 |
| Germany | 4.726,37 | 4.877,58 | 5.040,94 |
| India | 3.368,9 | 3.657,45 | 3.958,81 |
| United Kingdom | 3.120,06 | 3.239,2 | 3.356,79 |
| France | 3.183,64 | 3.299,49 | 3.411,71 |
| Italy | 2.280,1 | 2.333,36 | 2.387,83 |
| Brazil | 1.665,97 | 1.786,91 | 1.891,43 |
| Canada | 1.983,49 | 2.086,82 | 2.193,41 |
View from the Oriental Pearl Tower in Shanghai.
Population: forecast until 2025
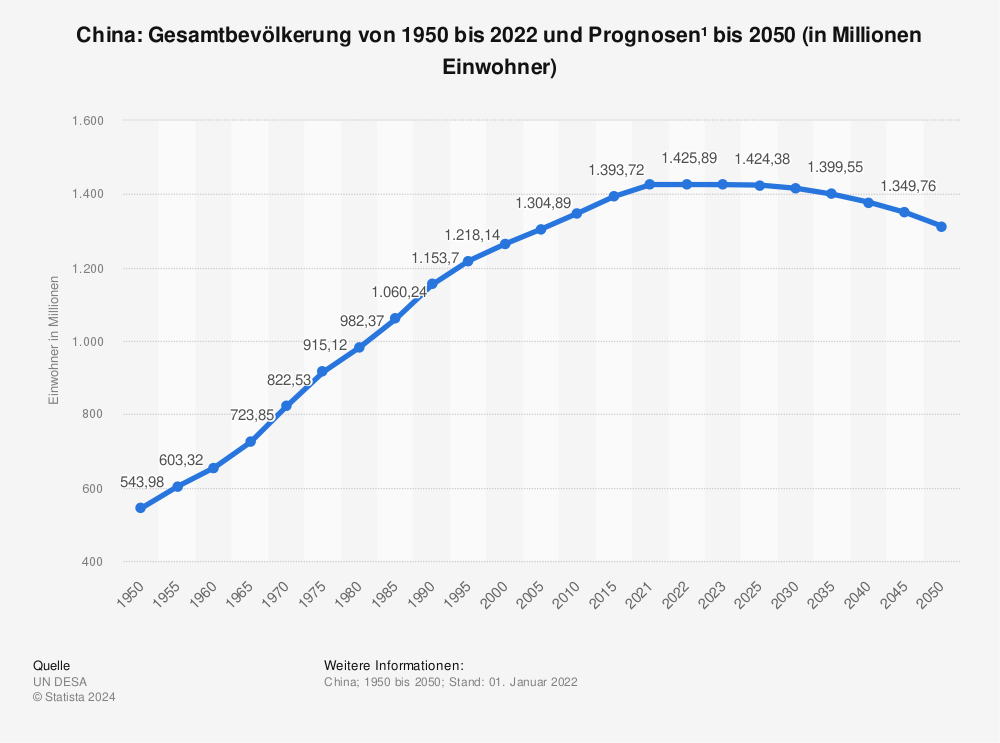
Not only is China one of the big players, the country continues to grow, as seen here, in total population from 1980 to 2018 and projections to 2025, with the population approaching one and a half billion by 2025.
- 2025 – 1,417 billion +0.9 %
- 2020 – 1,404 billion +2.18 %
- 2015 – 1,374 billion + 2.53 %
- 2010 – 1,340 billion + 5.76 %
- 2000 – 1,267 billion + 10.84%
- 1990 – 1,143 billion
- 1980 – 987.05 m
- …
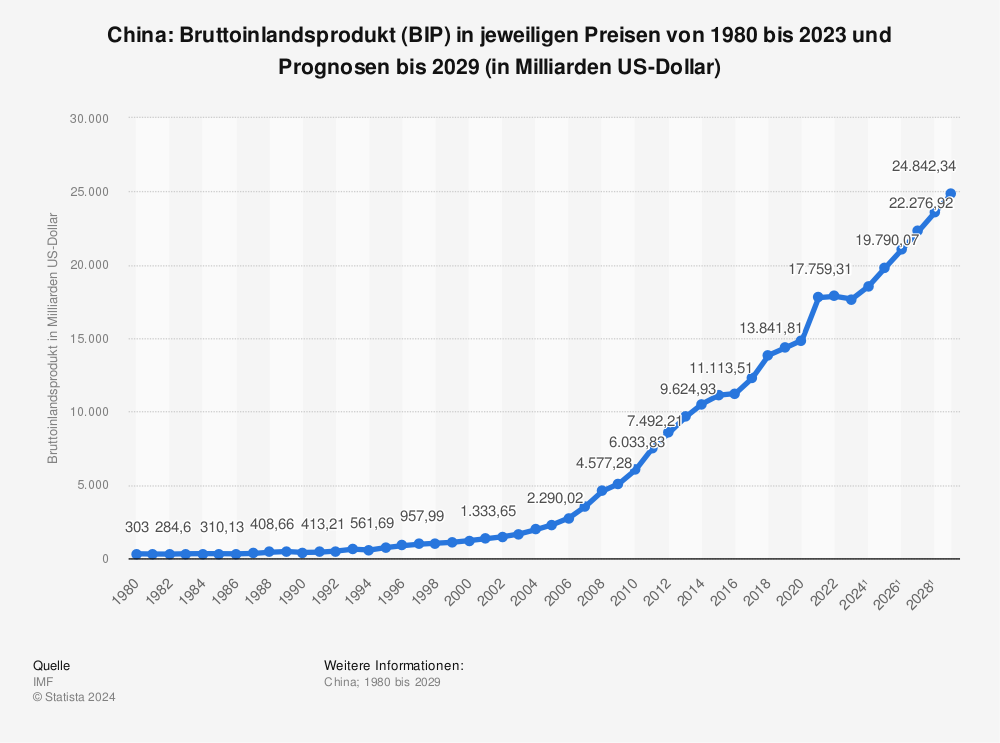
More and more inhabitants are earning more and more money. Since 2006/2008, the gross domestic product has been rising almost inexorably. Since statistics are worth a thousand words, here is the gross domestic product (GDP) in current prices, from 1980 to 2019 and forecasts, again with forecast to 2025 (in billions of US dollars).
- 2025 – $23,029 billion + 54.97 %
- 2020 – $14,860 billion + 33.71%.
- 2015 – $11,113 billion + 84.20%
- 2010 – $ 6,033 billion + 163.44 %
- 2005 – $ 2,290 billion + 90.04 %
- 2000 – $1,205 billion
- 1990 – $396 billion
- 1980 – $303 billion
- …
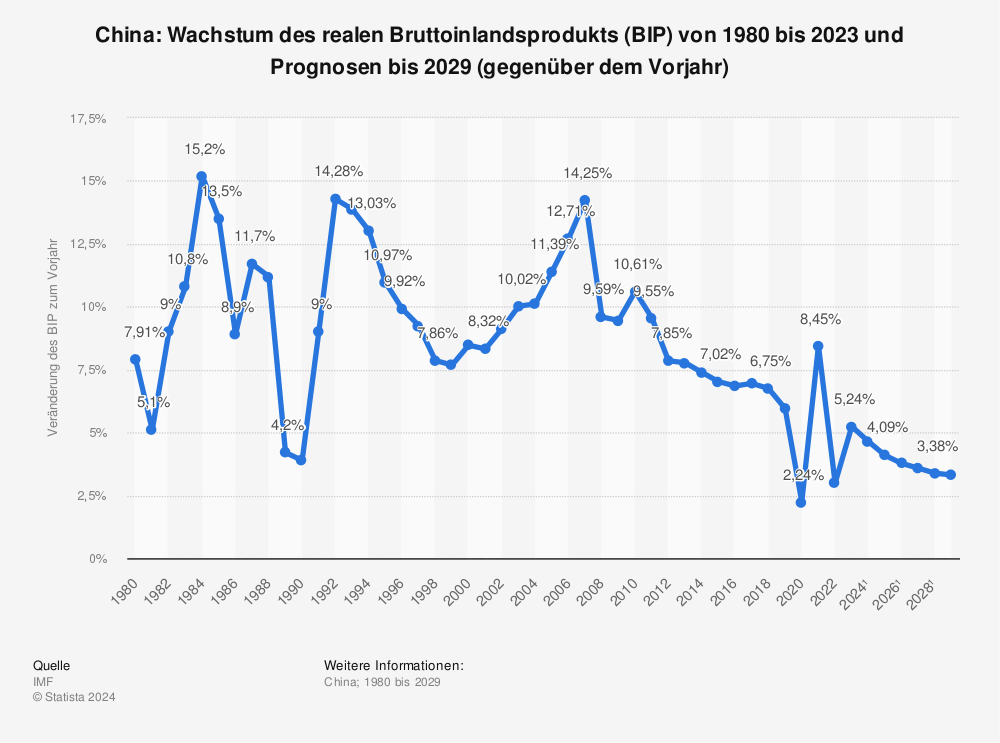
Here you can see once again the real growth of the gross domestic product (GDP) from 1980 to 2019 and forecasts to 2025 (compared to the previous year) visualized.
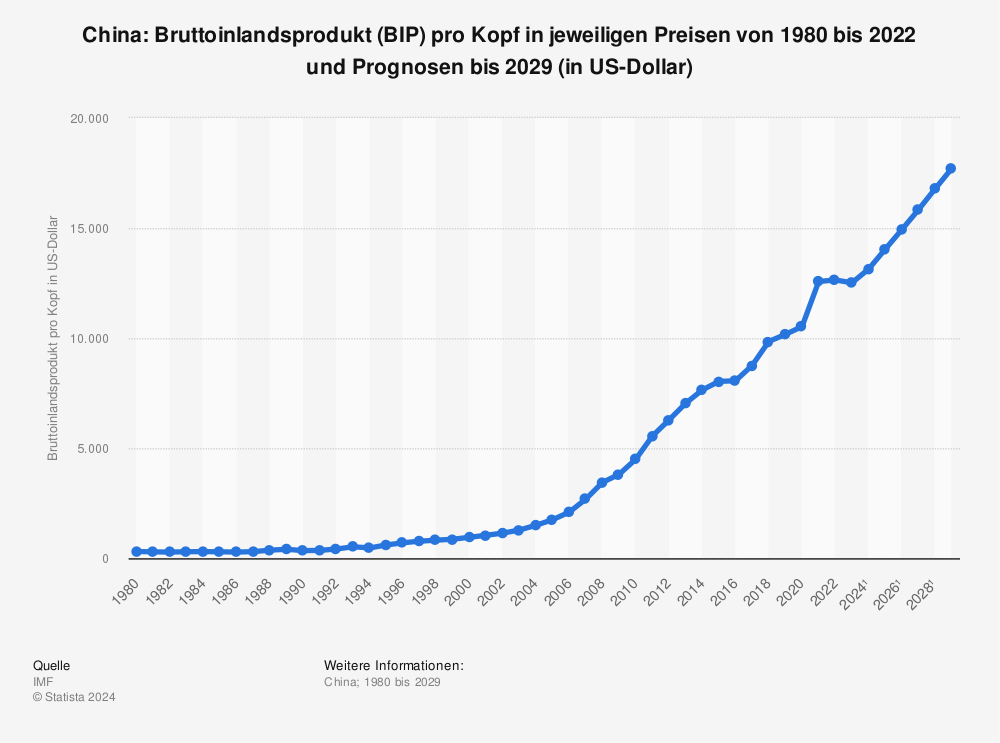
What does that mean per person? If you divide the GDP among individuals, it shows that the purchasing power of individuals in China is increasing and increasing. Another indicator that makes China one of the current and future sales markets.
- 2025 – 16.284,03 $ + 50,22 %
- 2020 – 10.839,44 $ + 34,07 %
- 2015 – 8.084,80 $ + 79,67 %
- 2010 – 4.499,79 $ + 373,08 %
- 2000 – 951,15 $ + 174,21 %
- 1990 – 346,86 $
- 1980 – 307,00 $
- …
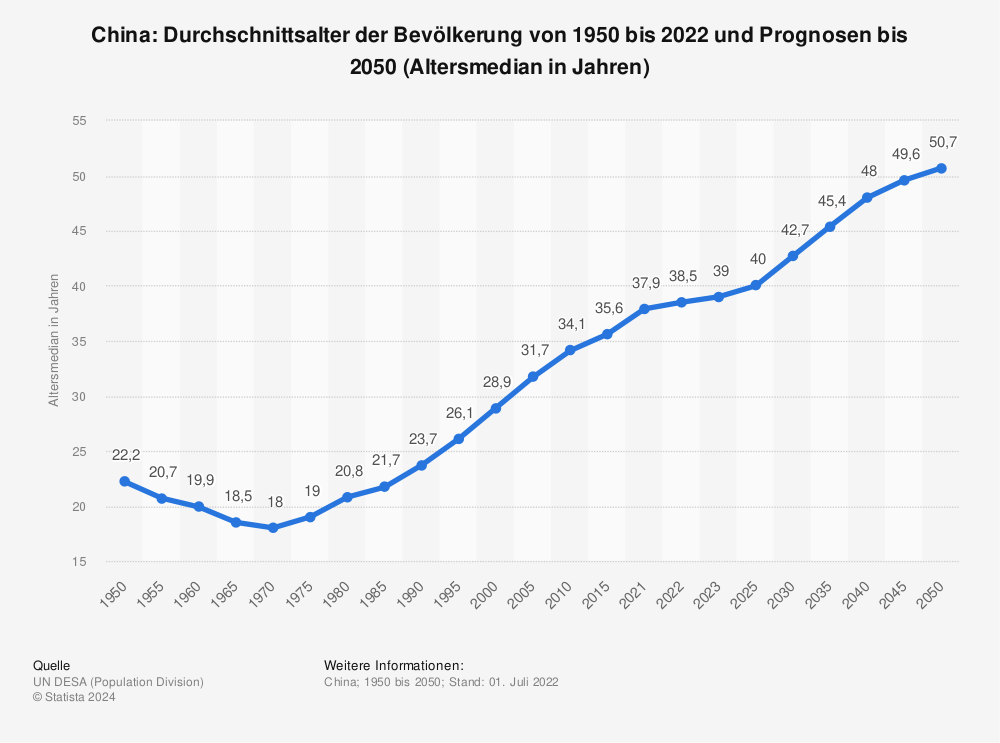
Who buys? Average age of the population from 1950 to 2020 and forecasts until 2050.
- 2050 – 47.6 years (+ 1.3 years)
- 2040 – 46.3 years (+ 3.7 years)
- 2030 – 42.6 years (+ 4.2 years)
- 2020 – 38.4 years (+ 3.2 years)
- 2010 – 35.2 years (+ 5.1 years)
- 2000 – 30.1 years
- …
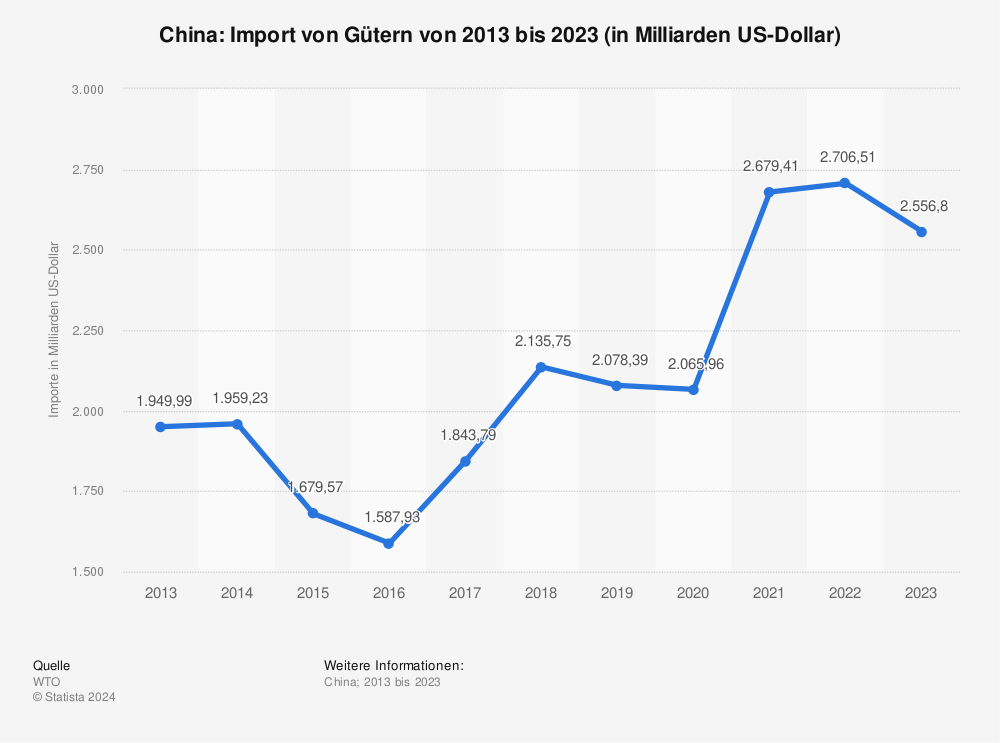
Import or own production? China: Import of goods from 2009 to 2019 (in billions of US dollars).
- 2019 – $2,077.1 billion + 23.67%.
- 2015 – $1,679.57 billion + 20.29%.
- 2010 – $1,396.25 billion
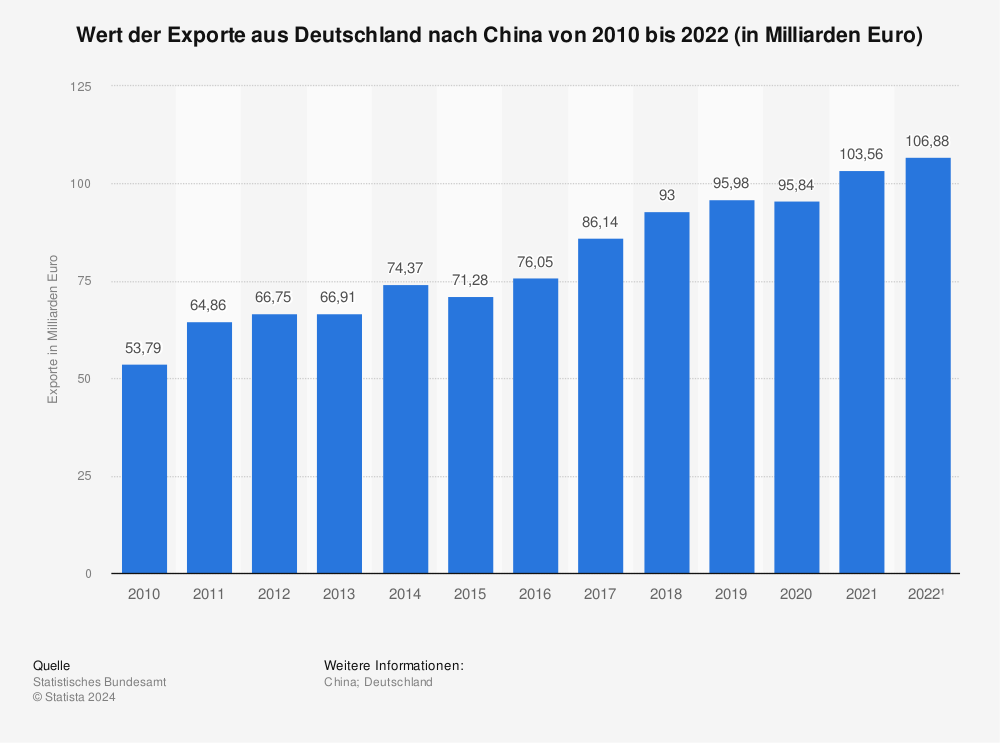
Value of German exports to China from 2007 to 2019 (in billions of euros).
- 2019 – $95.98 billion (+$24.7 billion)
- 2015 – $71.28 billion (+$17.49 billion)
- 2010 – $53.79 billion (+23.89 billion)
- 2007 – $29.9 billion
Shanghai’s inner city, with its large international financial community, is one of the arrival points for entrepreneurs who want to gain a foothold in China. So let’s take a look at the different types of companies that are possible in China (for foreigners).
Tax: Rental income in China
Source: Global Property Guide.
First of all, only Chinese citizens are allowed to own real estate in China!
Generally, rental property is subject to Individual Income Tax (IIT), Business Tax (BT) and Real Estate Tax (RET). In addition to these 3 taxes, there may be some other taxes and surcharges on rental income that vary from city to city. Local governments in some provinces have a lot of freedom when it comes to taxation. Therefore, tax rates and the calculation of taxable income vary from city to city.
- Individual Income Tax (IIT)
- Business Tax (BT)
- Real Estate Tax (RET)
Income tax: Letting of apartments
Investment income, including rental income, is taxed at a flat withholding rate of 20% of gross income.
Trade tax
Non-residents who earn rental income are subject to a 3% business tax. Taxable income is calculated by deducting business tax, operating costs, administrative costs and finance costs from gross income.
Property tax
The municipal property tax applies to companies and individuals with foreign investors. Owners of real estate (but not land) are subject to this tax, which is levied at 1.2% of the assessed value. If the property is rented out by the owner, the tax rate payable on this is 12%. This tax rate is levied on the annual rental income. A special case applies to the rental of residential property, in which case the rate may also be reduced to 4%. However, practice may vary within China as the applicable tax rates are set by local authorities, according to Global Property Guide.
This tax is payable to local governments and is paid annually in installments.
Tax: Capital gains
Only Chinese citizens are allowed to own land in China.
Income tax
Profit from the sale of real estate, are taxed at a flat rate of 20%. Taxable income is the gross sales price less acquisition costs and related reasonable expenses. The maximum deduction for property development costs is 10% of the property cost.
Trade tax
The sale itself is also subject to trade tax. This is 5% of the net profit.
Properties that have been owner-occupied for five years prior to sale are exempt. In Beijing, the time limit is one year.
Land Growth Tax
The land increment tax is a transaction tax, on the transfer of rights to use state-owned land, in China. It is based on net profit and levied at progressive rates. The taxable profit is determined by deducting the cost of acquiring the land, development costs, repair and maintenance costs, relevant tax payments and other amounts considered deductible by the tax authorities from the proceeds of the property sale.
The tax rates start at 30%. However, they could be as high as 60%. This depends on the tax base, which is the valuation of the net profit combined with all the deductions.
“Real estate limited liability company” in China?
Since direct real estate ownership is not possible for foreigners, here is a look at possible business models that can be entered into together with Chinese partners. For tips on setting up a company in China, I would like to refer to an external site with much more in-depth information on setting up a company.
This question comes up relatively often with investors who want to expand to China. In Germany, many like to set up a real estate GmbH or a family foundation. In Europe, as well as in America, people are used to the fact that setting up a company for activities in the local market is relatively easy. In China, however, it is the case that every time a foreigner sets up a company, a Chinese partner must be involved.
You can find more information about the company models here (external).
List of companies:
- Representative Office
- Company with exclusively foreign participation (WFOE)
- Foreign trading companies (FICE)
- Joint venture – joint ventures
- Partnerships with foreign shareholders (Foreign Invested Partnerships)
- Branches
More and more are investing in China, of course on the stock market. Stocks like Tencent, Xi and also new ones like Niu (electric car) are gaining month by month. Accordingly, more and more are thinking about investment properties in China. From single stock, ETFs to currency trading.
Here’s a list of holdings that I find exciting:
| Name | Ticker | Net assets (%) | Market Price ($) |
| Country Garden | 2007 HK | 9.27 | 1.31 |
| Sunac China Holdings Ltd | 1918 HK | 8.73 | 3.74 |
| Longfor Group Ho | 960 HK | 8.65 | 5.64 |
| China Resources Land Ltd | 1109 HK | 8.28 | 3.96 |
| China Overseas | 688 HK | 7.05 | 2.01 |
| Ke Holdings Inc | BEKE | 5.26 | 65.28 |
| Wharf Holdings Ltd | 4 HK | 4.1 | 2.54 |
| China Vanke Co Ltd-h | 2202 HK | 3.83 | 3.47 |
| China Evergrande Group | 3333 HK | 3.42 | 1.85 |
| Shimao Group Holdings Ltd | 813 HK | 3.36 | 2.97 |
Data: Global X ETFs
Which companies are listed on the German stock exchange? Here is an insight into the top 30 real estate stocks in Germany:


