Hamburg buy & rent – condominiums, single-family houses and apartment buildings, in Hamburg everything is rare! The city is more popular than ever. Rents are rising, but so are purchase prices for land and property. We take a look at the current figures and prices for Hamburg. Where are new properties being built, how are the districts developing and how realistic is it to find a good property without an agent? We also have many tips for tenants, rental prices for apartments, commercial properties and offices.
First we take a detailed look at current statistics for buyers. Here you will find a lot of information, from the purchase price for a newly built condominium to tips for renting property and answer the question: Buying in Hamburg?
Price for condominiums
New building: what’s being built?
Highest real estate loans: 3rd place Hamburg
Buying in Hamburg?
Buying an apartment without an estate agent
Number of sales of luxury homes
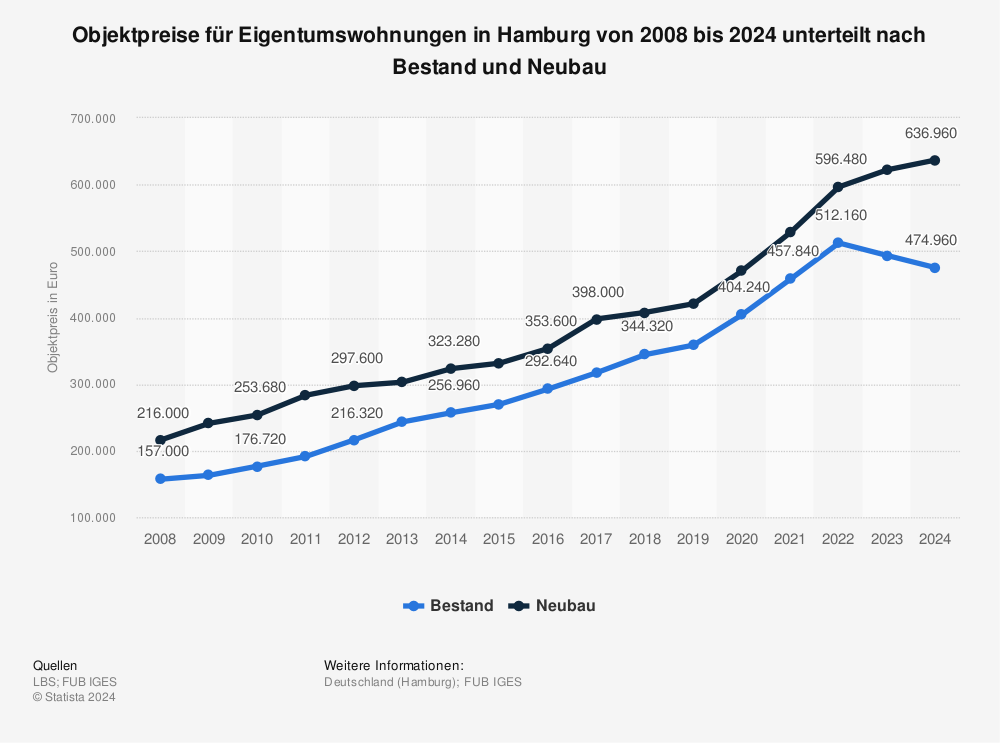
Price for condominiums
Property prices for condominiums in Hamburg from 2008 to 2019, broken down into existing and new construction.
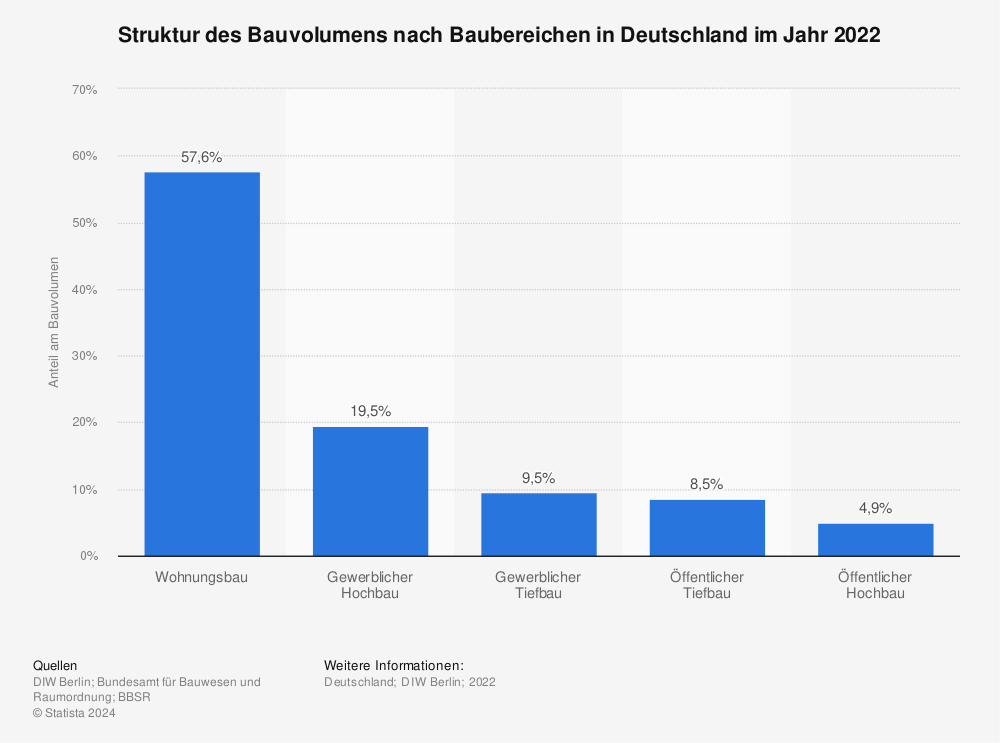
What else is being done in housing construction? Here you can see the structure of the construction volume according to construction sectors in Germany in 2018.
The chart shows a ranking according to highest average mortgage loan in the 20 largest cities in Germany based on a current evaluation of the comparison platform Check24. Loans of 500,000 euros are compared here, for 101 square metres of living space.
Munich – 504,000 Euros
Frankfurt – 417,000 Euro
Hamburg – 384,000 Euros
…
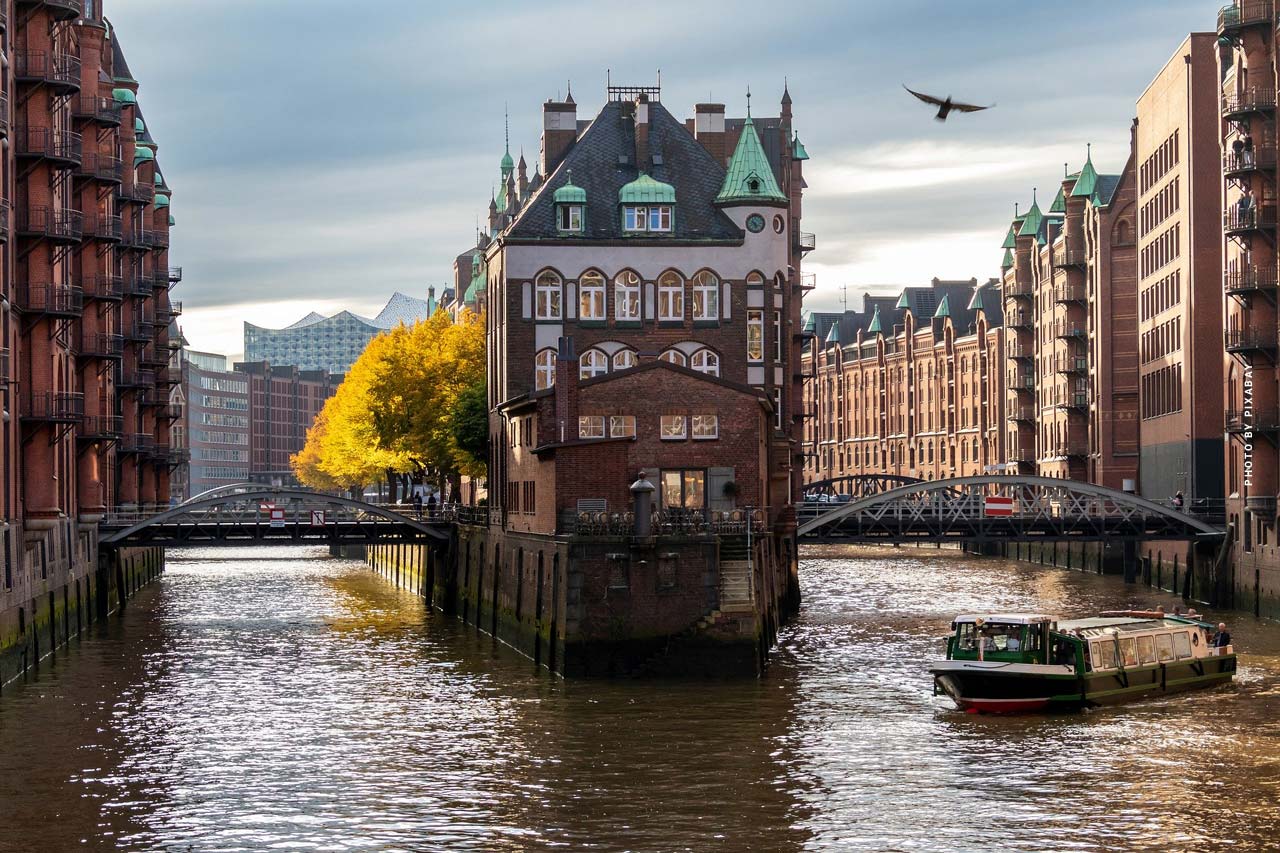
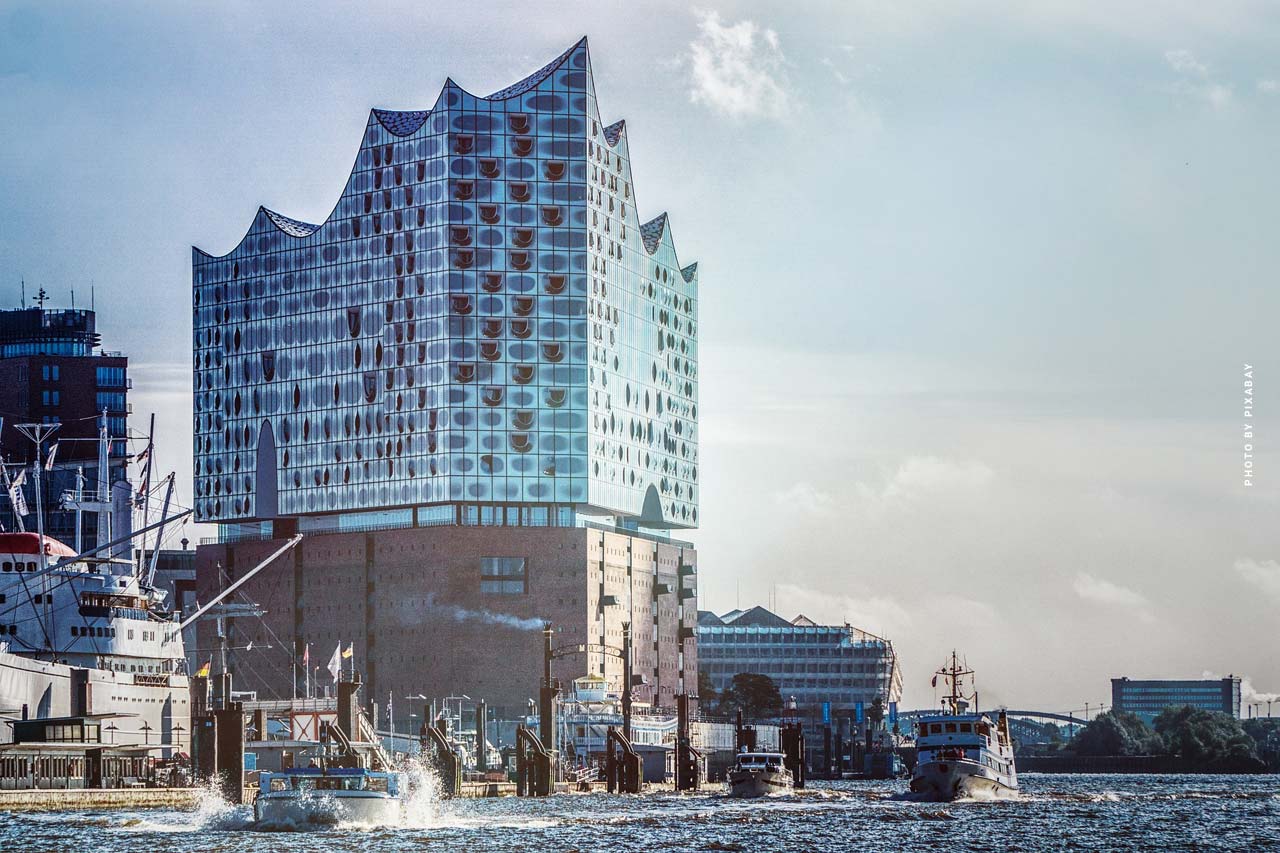
View of Hamburg and the new landmark, the Elbphilharmonie Concert Hall.
On the ground floor you have a view of the city centre, shopping streets and the busy life.
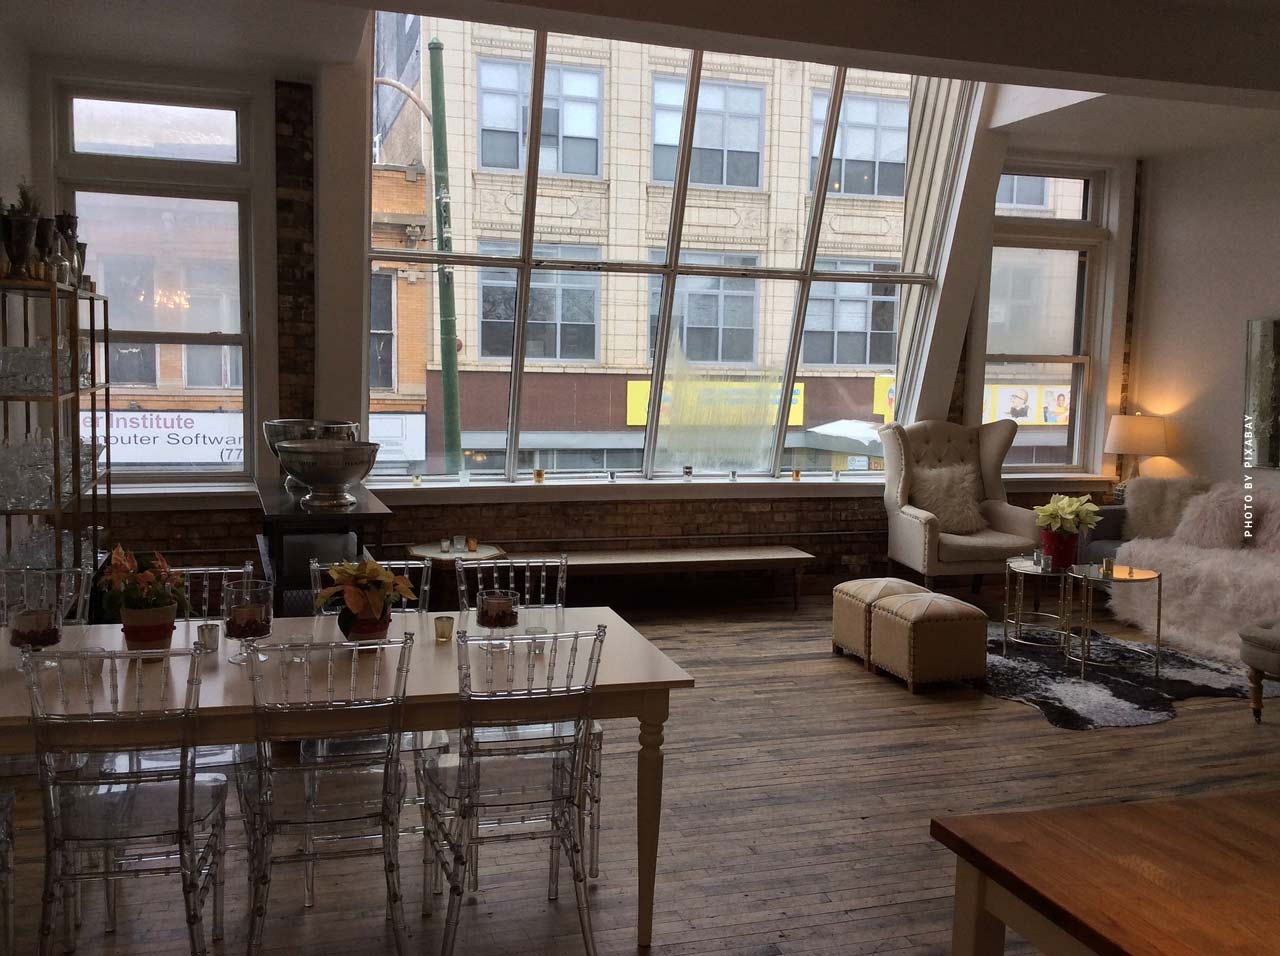
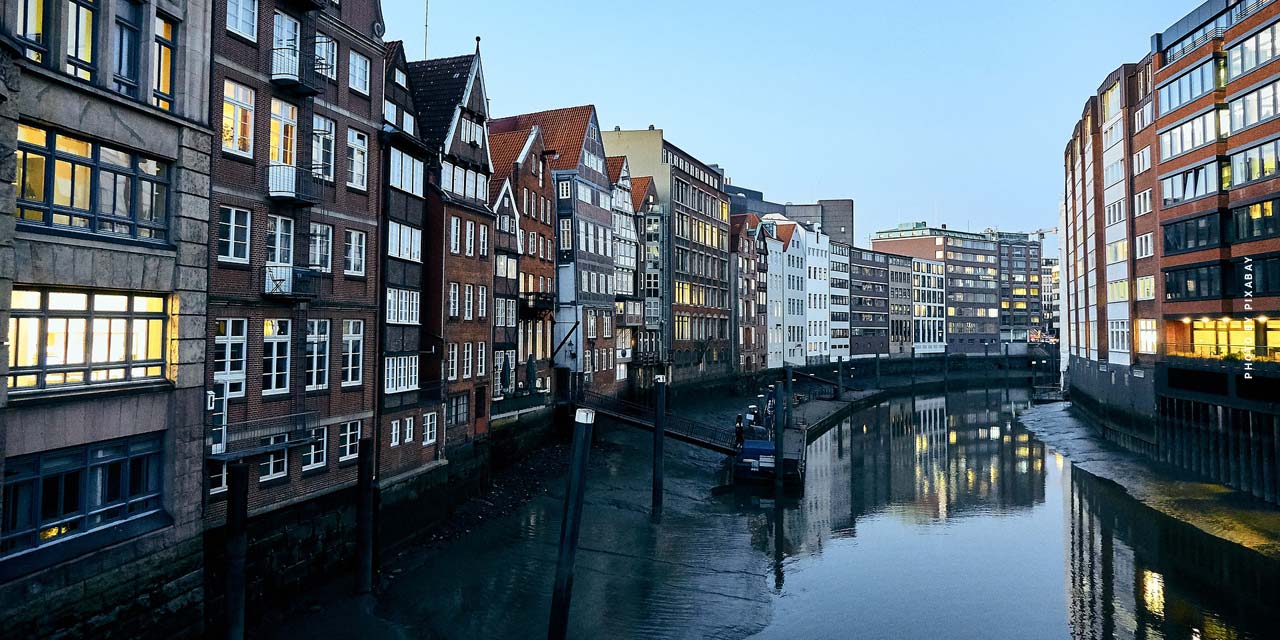
In many parts of the city you can also find exclusive objects that have been converted, for example from old dockyard halls, now with loft character.
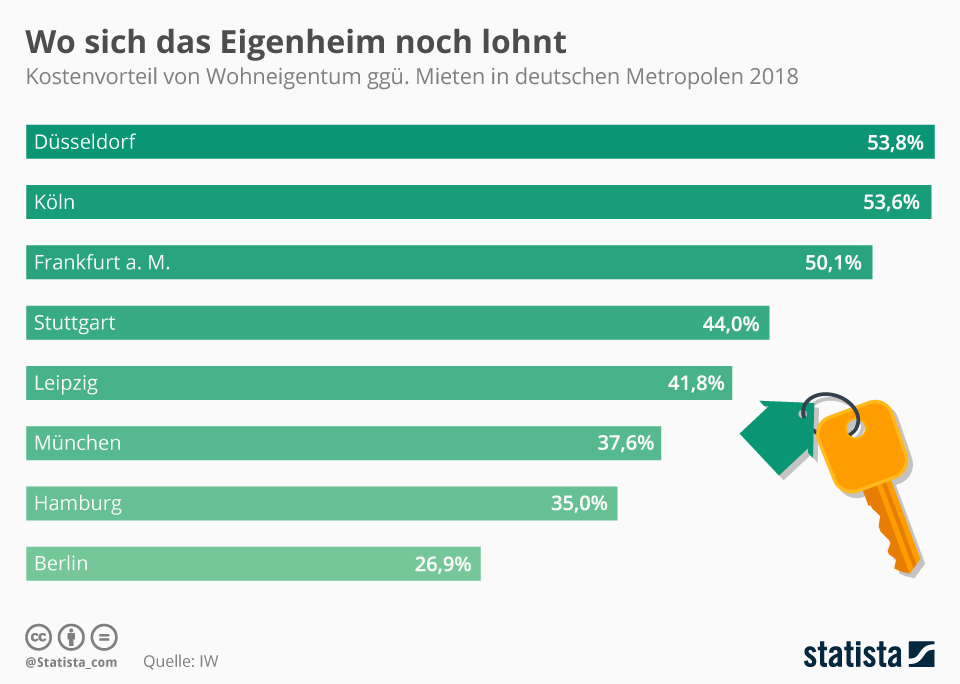
Where is it worth buying? comparison
Where is it worth buying a property (house, semi-detached house, condominium, etc.)? In comparison, one sees the potential that lies dormant above all in NRW and Hessen. This chart shows the cost advantages of home ownership compared to rents in German metropolitan areas in 2018.
The chart shows the proportion of condominiums advertised by real estate agents in 2016.
2 of 3 condominiums – 65.1% of Hamburg properties are offered by real estate agents
Here you can clearly see that the majority of the market is in the hands of experienced real estate agents. High-quality and good properties are always sold with the help of an estate agent. After all, it is not “only” about the viewing. Buyer acquisition, network, negotiations, credit assessment, purchase contracts, all this belongs to the profession of an estate agent.
78.6% of Berlin’s condominiums through real estate agents
How many luxury properties are sold and bought in Germany each year? These statistics show how manageable the market is. Here you can see the number of sales of luxury homes in selected cities in Germany.
Data show for visualization last survey in the first half of 2010 and 2011. A new, world-famous landmark has been added, the Elbphilharmonie Concert Hall in Hamburg.
In particular, land, houses and condominiums with a view of the water are in great demand. Accordingly, the cooperation with estate agents is worthwhile, because 3 out of 4 properties are only sold through estate agents.
Rent: Prices, stock and development
Rental price for apartments
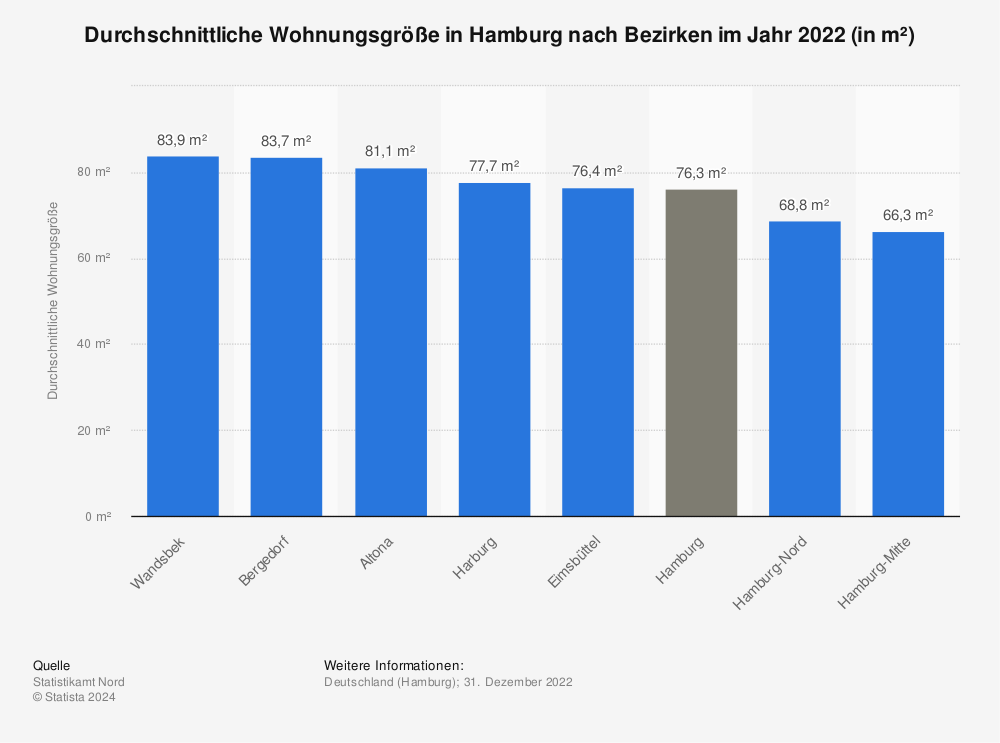
Living space per apartment
Rental price for dream apartment
Service charges in comparison
Development of the housing stock
Rent a commercial property
Rent office: compare prices
Rent office: Free areas and practices
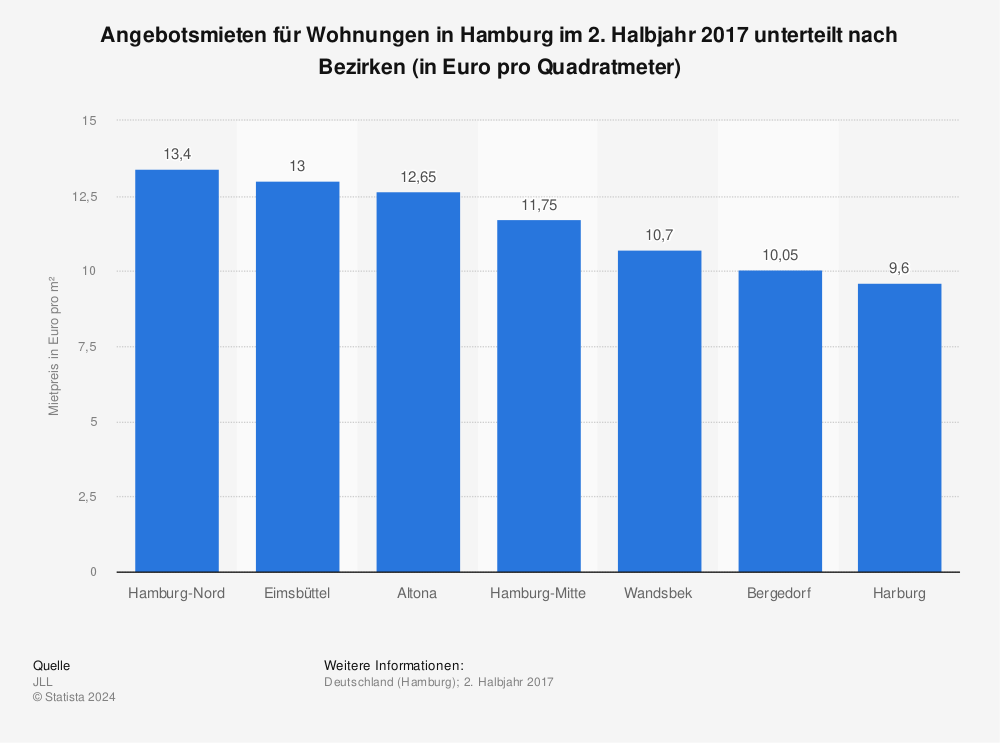
Rental price for apartments
Offered rents for apartments in Hamburg in the second half of 2017, broken down by districts (in euros per square metre).
Hamburg ranks 4th in the ranking of the rent one would pay for an apartment. This puts the city, as always, at the top of the nationwide comparison of average rents. The chart shows the average rent for an apartment with 3 to 4 rooms (81 to 105 sqm).
The chart shows the total ancillary housing costs per year for a three-person household (in euros). The average in Germany is EUR 1,900.84 per year. The cheapest cities for ancillary costs are:
Location is everything! Especially for entrepreneurs and companies. In all major cities the rents for commercial properties are rising, only in Berlin the costs for the monthly rent are getting cheaper, and that in the best location. This chart shows the indexed costs for commercial real estate in the largest cities in Germany (Hamburg, Cologne, Frankfurt, Munich and Berlin) in comparison. A joint index takes into account shop rents in prime locations, shop rents in secondary centres, office rents in city centres and the prices for commercial properties.
Where are office rents currently highest? Hamburg is right at the top, with current average office rents of 29.00 euros / m². Here you can see the top rents for office space in German cities.
Finding the perfect Hamburg – How does Berlin compare to the other German cities? How many free spaces and practices are there in relation to Berlin, Munich & Co. This chart shows the proportion of vacant office space as a proportion of total office space in selected German cities in 2018.
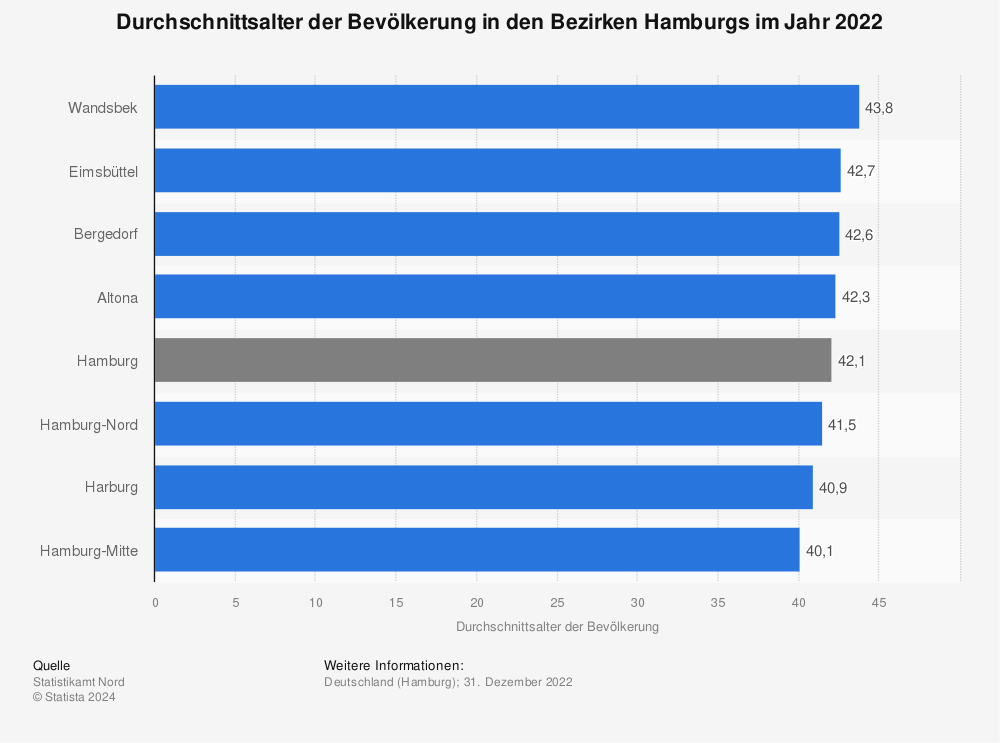
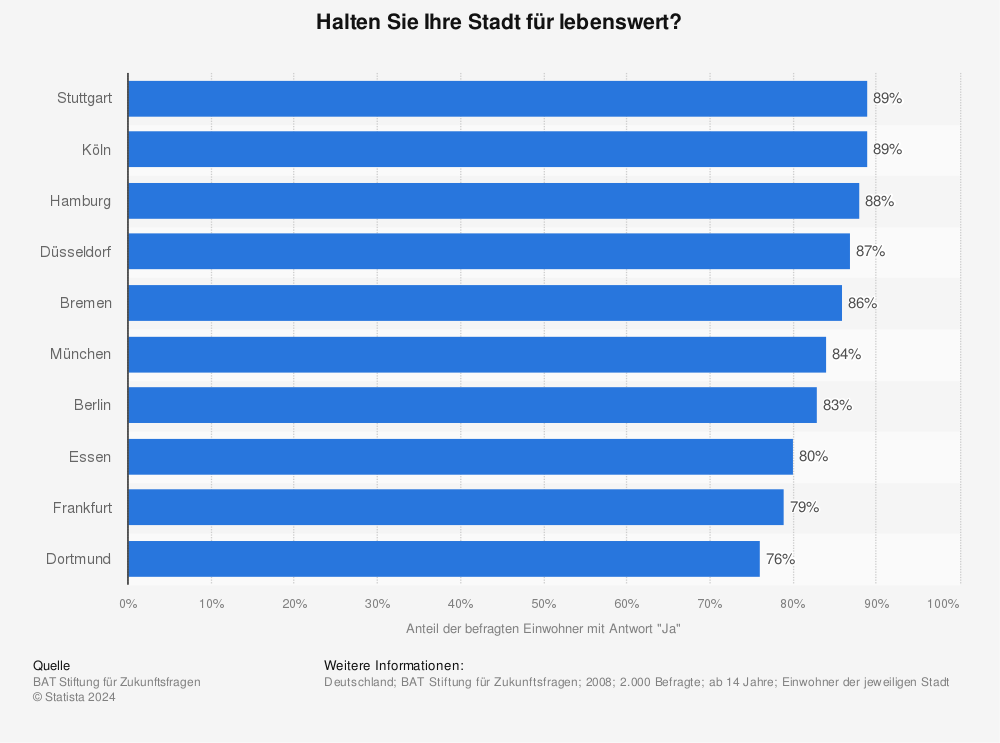
Do you consider your city worth living in? Hamburg is in third place with 88%. This means that 9 out of 10 people in Hamburg also appreciate the qualities of the city, from Wandsbek to Eimsbüttel.
Stuttgart – 89% think the city is worth living in! 9 out of 10 people live in Stuttgart
Where do most of the inhabitants live? Here you see visualized, the 4 biggest cities in Germany. The graph shows the number of inhabitants in the German megacities on 31 December 2018, at the turn of the year 2018 / 2019.
How is Hamburg developing as a city and federal state? Here you can see the number of private households in Germany by federal state in 2018 and forecast for 2030 (in 1,000). This is an optimal situation for landlords as the demand for living space increases.
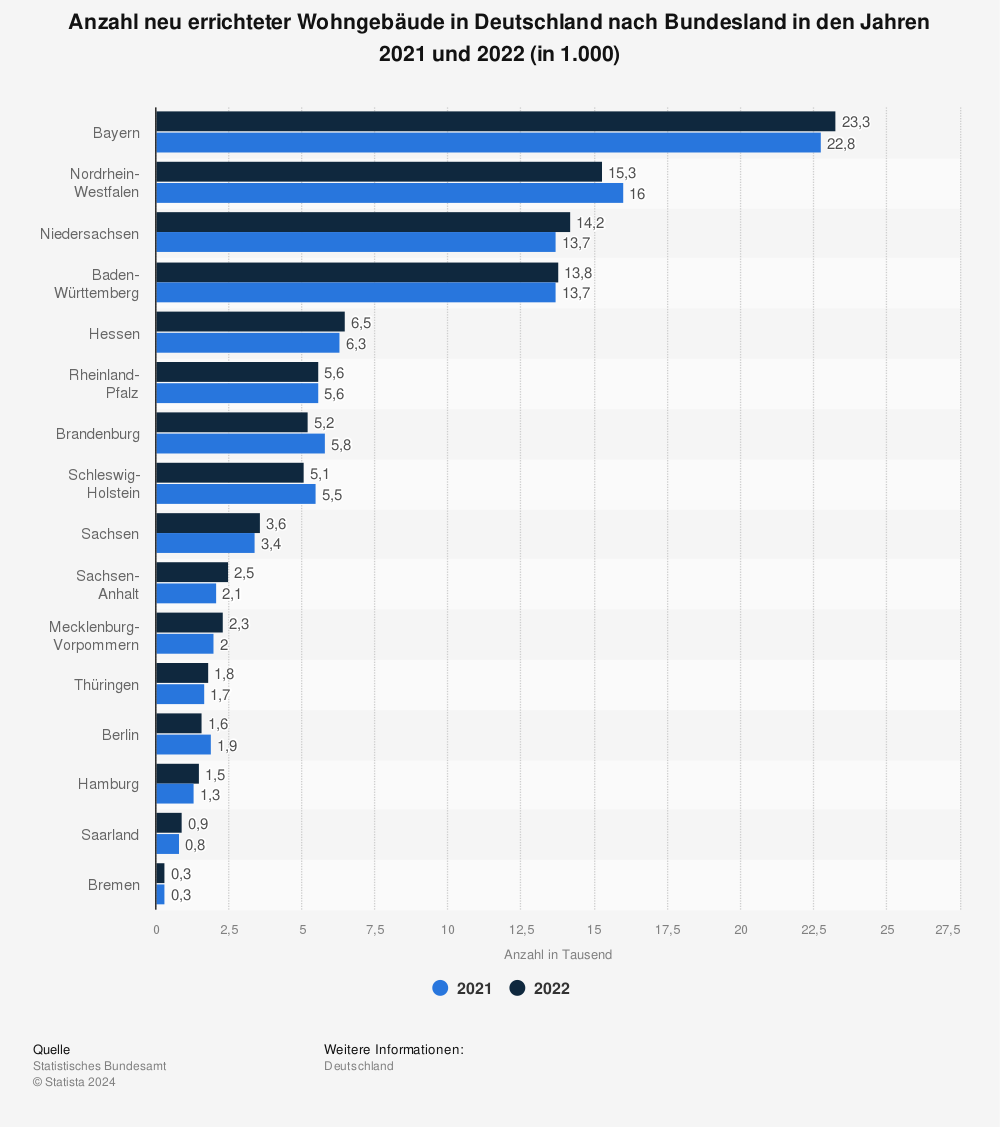
New construction: Where are new apartments being built? Number of newly constructed residential buildings in Germany by federal state in 2017 and 2018 (in 1,000).


 More statistics can be found at Statista
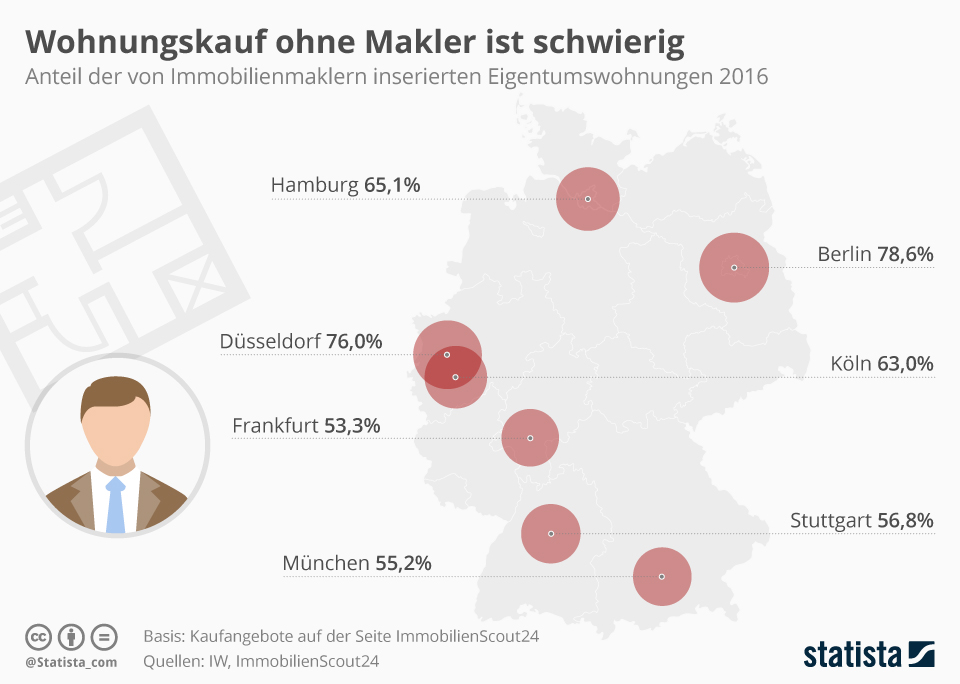 More statistics can be found at Statista
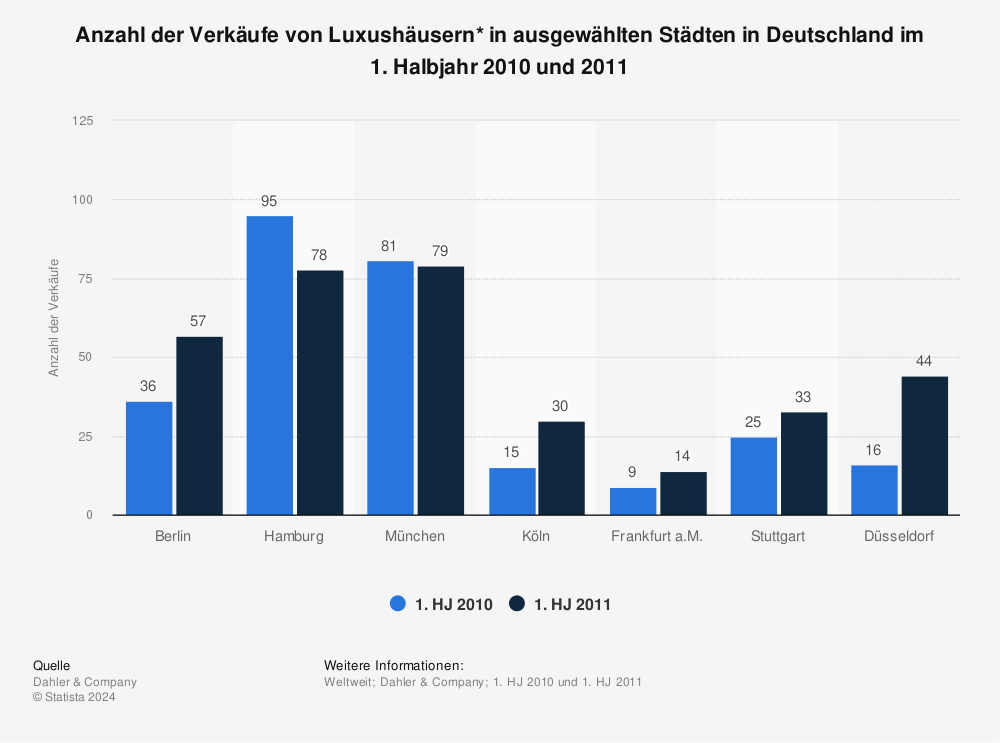
 More statistics can be found at Statista
 More statistics can be found at Statista
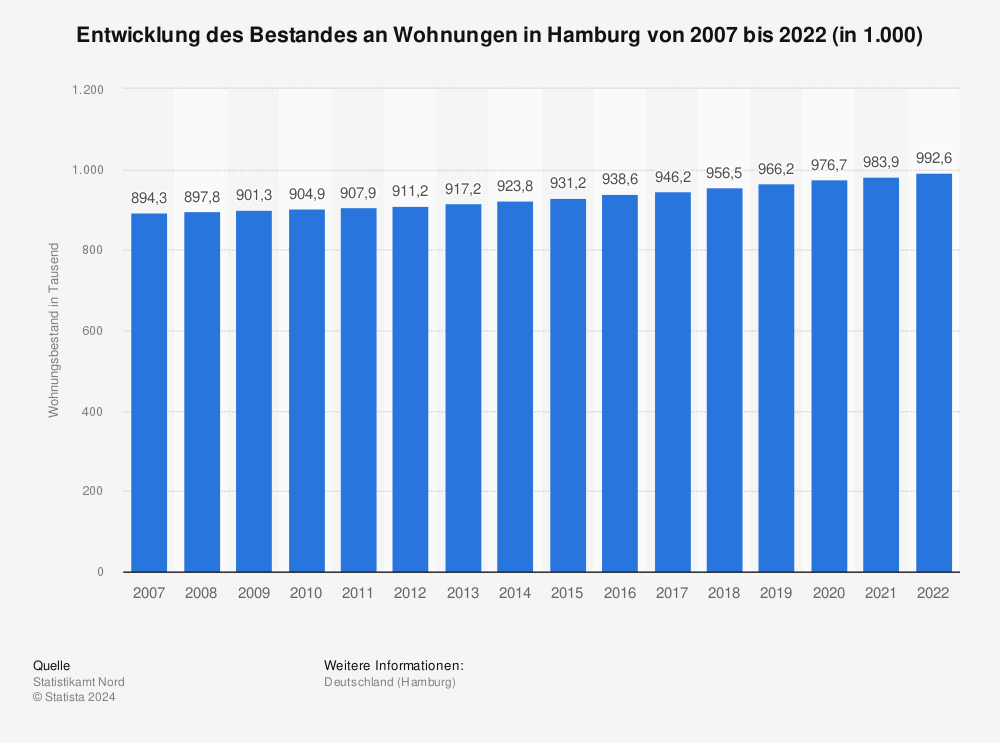
 More statistics can be found at Statista
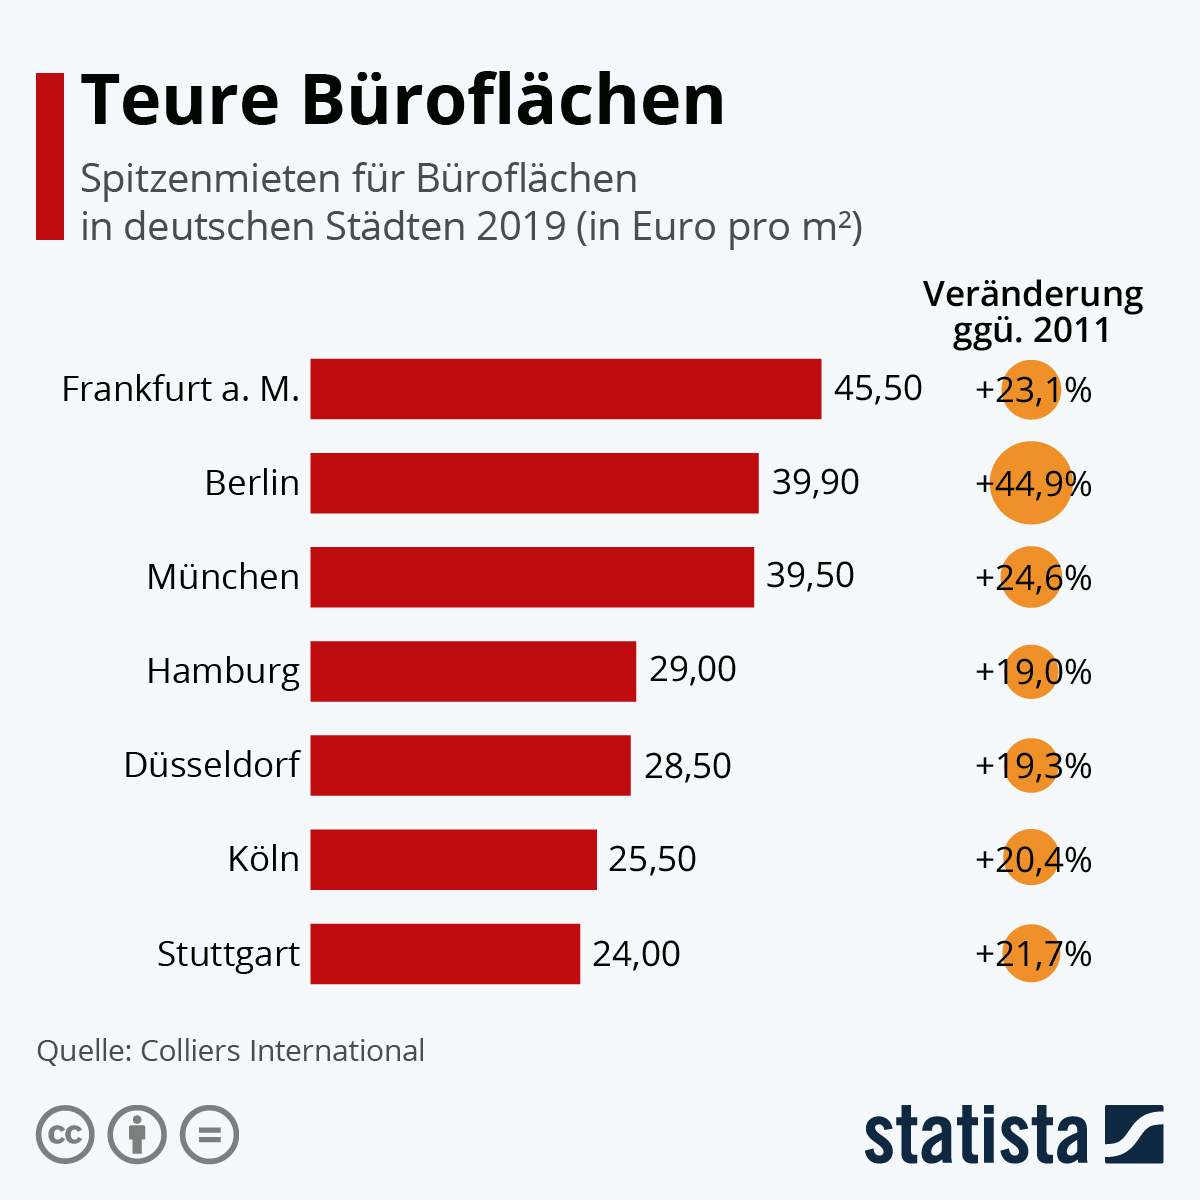 More statistics can be found at Statista
 More statistics can be found at Statista