Weather in Gelsenkirchen: Temperature, fog and clouds
Weather Gelsenkirchen (6. September 2025) – The forecast weather for construction sites in Gelsenkirchen. The relevant data for building statics, ventilation system, sustainability to floorboards at a glance . Here you can find the weather in Germany.
Temperatures in Gelsenkirchen
Current
Gelsenkirchen temperatures current on 6. September 2025.
Forecast: Today / 3 days
Current in Germany
Forecast for Gelsenkirchen: 12 hours
Wind in Gelsenkirchen
Unusual temperature fluctuations and heavy precipitation affect the activities of the booked craftsmen. Humidity or even thunderstorms, weather factors have quite a big impact the speed of construction. Mortar such as masonry mortar and tile adhesive, wood and non-ferrous metals such as aluminum and copper, of course, the storage of planned building materials must also be considered. The construction of one’s own property wants to be planned in detail even before construction begins, this includes simple questions such as “What does heavy rain mean?” but also “What does high humidity mean?” Here it is a matter of extremely extensive individual construction details for property developers: outdoor, construction planning, construction container, laying tiles or building plan. All seasons, all months their very individual advantages and disadvantages with. At the start of construction, the calculable humidity should be considered in the previous construction planning.
Current
Forecast: 12 hours
Forecast: Tomorrow
Wind in Germany: Current
Wind in Germany: Tomorrow
Wind gusts
Summation of all winds
Rain for Gelsenkirchen
Cloud formation: Today
Cloud formation: Tomorrow
Rainfall: Today
Rainfall: Tomorrow
Rainfall in Germany: Today
Rainfall in Germany: Tomorrow
Humidity: Today
Weather alerts
Thunderstorms: Today
Fine dust and CO2
CO content in Gelsenkirchen
CO content (fine dust) in Germany
Statistics & Average
Temperature (°C)
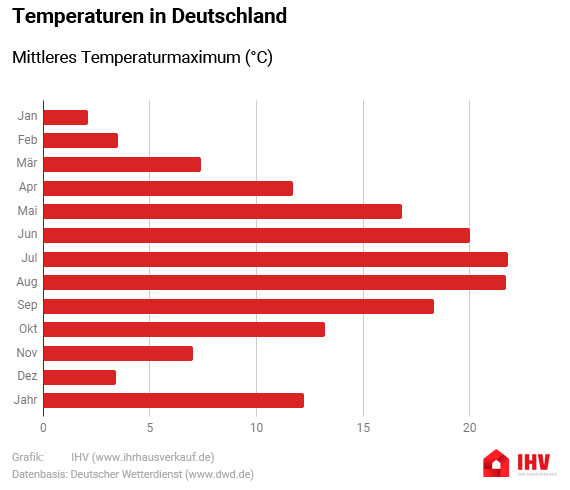
Mean maximum temperature (°C)
| Jan | Feb | Mar | Apr | May | Jun | Jul | Aug | Sep | Oct | Nov | Dec | Year |
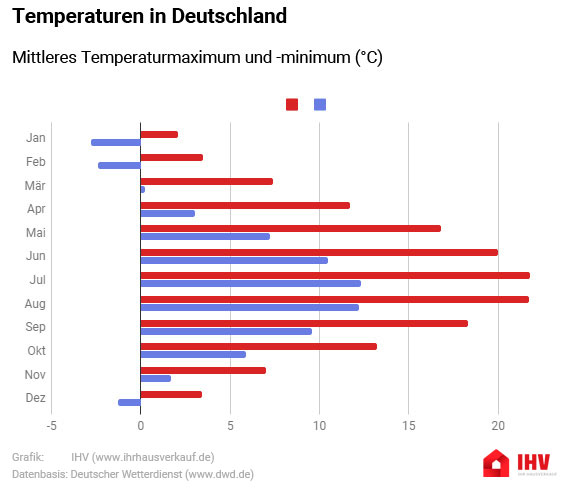
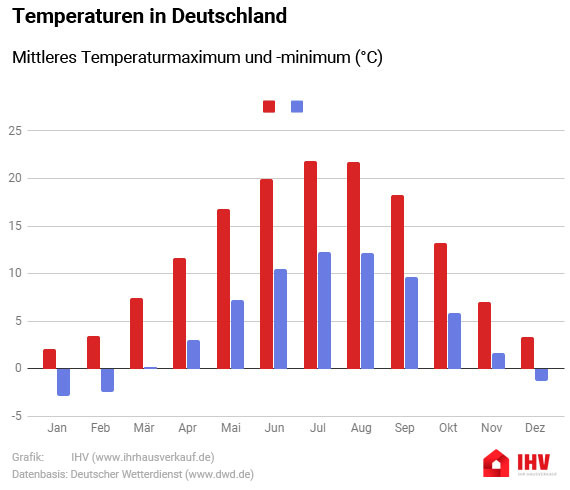
| 2,1 | 3,5 | 7,4 | 11,7 | 16,8 | 20 | 21,8 | 21,7 | 18,3 | 13,2 | 7 | 3,4 | 12,2 |
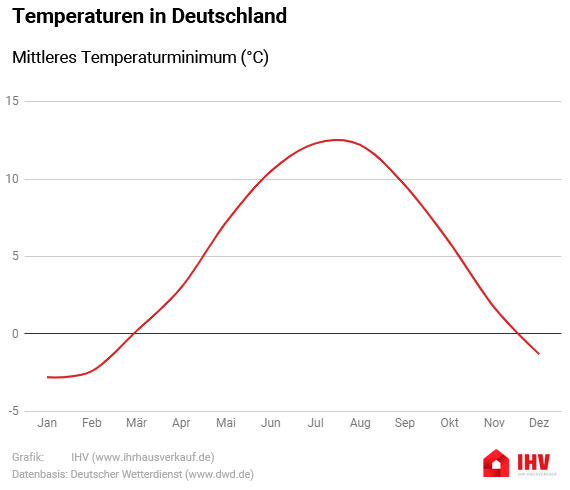
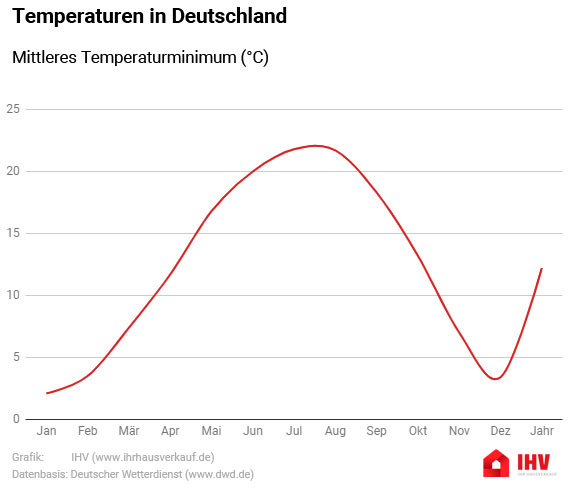
Mean minimum temperature (°C)
| Jan | Feb | Mar | Apr | May | Jun | Jul | Aug | Sep | Oct | Nov | Dec | Year |
| -2,8 | -2,4 | 0,2 | 3 | 7,2 | 10,5 | 12,3 | 12,2 | 9,6 | 5,9 | 1,7 | -1,3 | 4,7 |
Comparison of mean maximum and minimum temperatures (°C)
Rain
Mean monthly precipitation (mm)
| Jan | Feb | Mar | Apr | May | Jun | Jul | Aug | Sep | Oct | Nov | Dec | Year |
| 54,1 | 44,6 | 52,1 | 57,4 | 69,2 | 81,3 | 75,2 | 74,3 | 59,8 | 53 | 63,2 | 61,4 | 746,2 |

Days with precipitation > 1mm (days)
| Jan | Feb | Mar | Apr | May | Jun | Jul | Aug | Sep | Oct | Nov | Dec | Year |
| 11 | 9 | 10 | 10 | 11 | 11 | 10 | 10 | 9 | 9 | 11 | 11 | 121 |
 Data basis: German Weather Service
