Weather in Kassel: Thunderstorms, temperature and rain
Weather Kassel (16. January 2026) – weather in Kassel. Thunderstorms, humidity or even wind: Here we have all construction-relevant weather forecasts for today, tomorrow and the day after tomorrow. Click here for the weather in Germany.
Temperatures in Kassel
Current
Kassel’s temperatures current on 16. January 2026.
Forecast: Today / 3 days
Current in Germany
Forecast for Kassel: 12 hours
Wind in Kassel
In particular, it is also about the safe storage of building materials, such as high-quality natural stones like granite, limestone, slate and marble and also permanently used sealants. Lightning, downpour or even rain, on site at the construction site there are many external factors to consider. Your own first house construction will be affected by the occurrence of extreme temperatures, gusts and precipitationfor this reason precautionary planning is also worth a lot.
Because depending on which months are built, there are various advantages and disadvantages for you as a builder and the contracted companies. When it comes to weather forecasting, humidity should always be on your mind. Among the most frequently asked questions are “How is rain measured?” or “What does hurricane mean?” For construction companies, there are a lot of small details to consider, these include winterizing, hot tub, burglary protection, construction defects, and building plan.
Current
Forecast: 12 hours
Forecast: Tomorrow
Wind in Germany: Current
Wind in Germany: Tomorrow
Wind gusts
Summation of all winds
Rain for Kassel
Cloud formation: Today
Cloud formation: Tomorrow
Rainfall: Today
Rainfall: Tomorrow
Rainfall in Germany: Today
Rainfall in Germany: Tomorrow
Humidity: Today
Weather alerts
Thunderstorms: Today
Fine dust and CO2
CO content in Kassel
CO content (fine dust) in Germany
Statistics & Average
Temperature (°C)
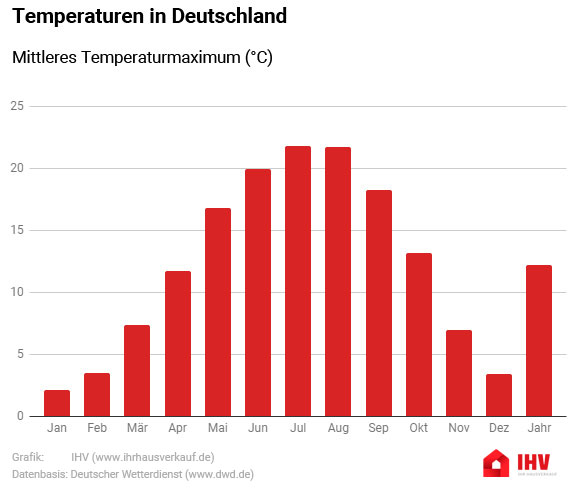
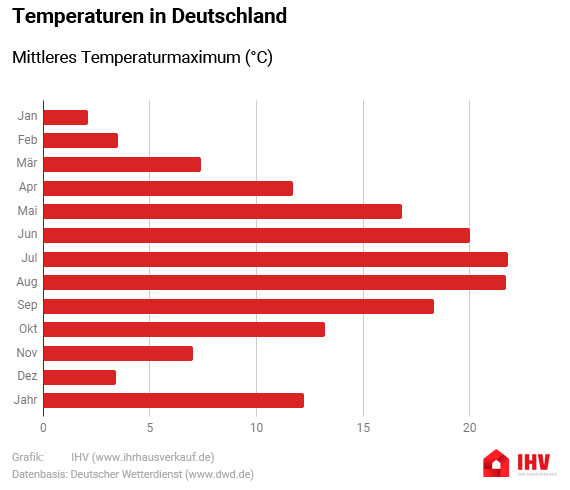
Mean maximum temperature (°C)
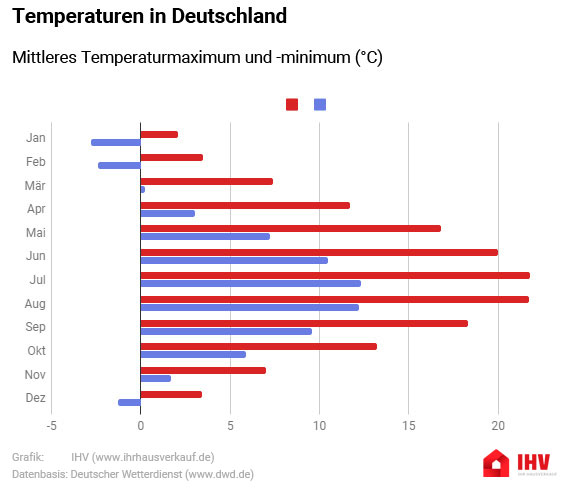
| Jan | Feb | Mar | Apr | May | Jun | Jul | Aug | Sep | Oct | Nov | Dec | Year |
| 2,1 | 3,5 | 7,4 | 11,7 | 16,8 | 20 | 21,8 | 21,7 | 18,3 | 13,2 | 7 | 3,4 | 12,2 |
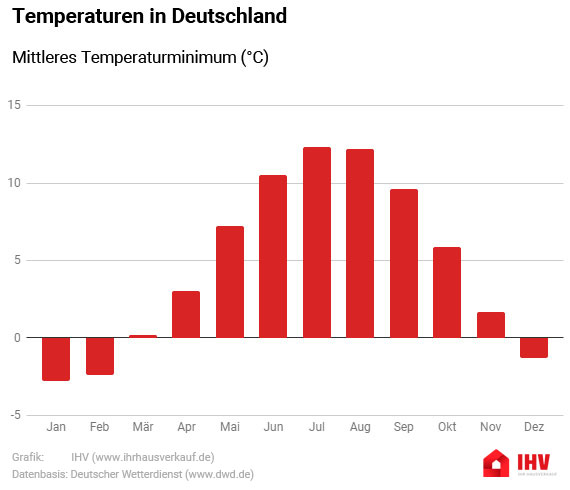
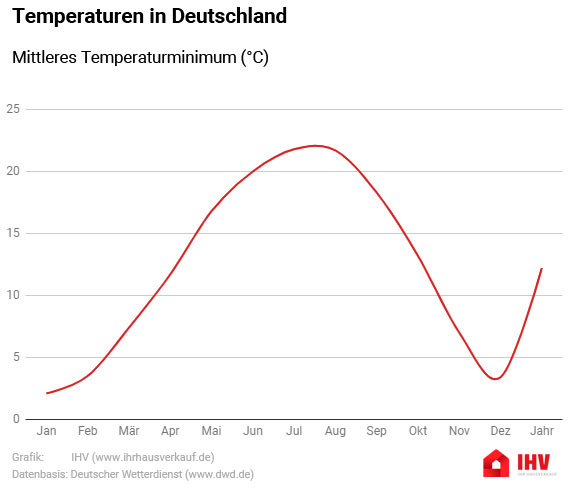
Mean minimum temperature (°C)
| Jan | Feb | Mar | Apr | May | Jun | Jul | Aug | Sep | Oct | Nov | Dec | Year |
| -2,8 | -2,4 | 0,2 | 3 | 7,2 | 10,5 | 12,3 | 12,2 | 9,6 | 5,9 | 1,7 | -1,3 | 4,7 |
Comparison of mean maximum and minimum temperatures (°C)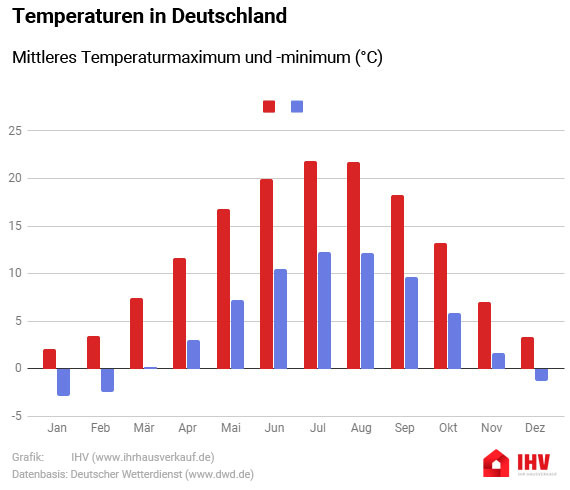
Rain
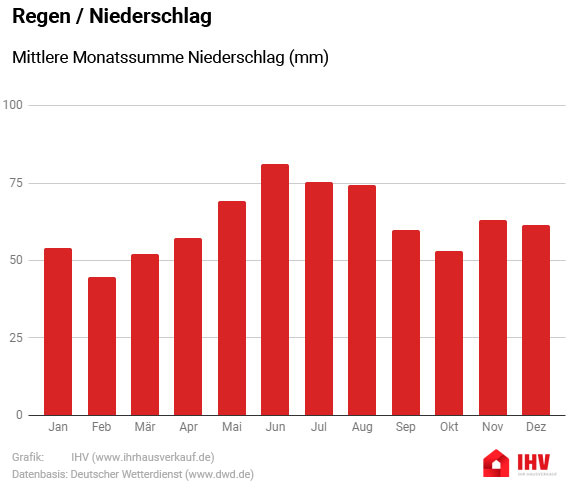
Mean monthly precipitation (mm)
| Jan | Feb | Mar | Apr | May | Jun | Jul | Aug | Sep | Oct | Nov | Dec | Year |
| 54,1 | 44,6 | 52,1 | 57,4 | 69,2 | 81,3 | 75,2 | 74,3 | 59,8 | 53 | 63,2 | 61,4 | 746,2 |
Sunshine
Mean daily sum sun (h)
| Jan | Feb | Mar | Apr | May | Jun | Jul | Aug | Sep | Oct | Nov | Dec | Year |
| 1,6 | 2,7 | 3,8 | 5,3 | 6,8 | 7,1 | 7,1 | 6,7 | 5,2 | 3,7 | 2 | 1,4 | 4,5 |

Data basis: German Weather Service

