Weather in Hannover: Rain, fog and sunshine hours
Weather Hannover (23. April 2025) – Will it rain a lot in Hannover today? Thunderstorms, wind and humidity: The relevant data for builders. The weather in Germany.
Temperatures in Hannover
Current
Hanover’s temperatures current on 23. April 2025.
Forecast: Today / 3 days
Current in Germany
Forecast for Hanover: 12 hours
Wind in Hanover
Humidity or even rain, heavy rain and wind have a grip on the construction site and the trades here in Hanover, especially in the colder months. Disproportionate fluctuations in temperature as well as heavy precipitation and humidity affect the processes on the construction site. Asphalt such as asphalt concrete, Stone Mastic Asphalt and natural asphalt, elastomers and also concrete such as light, normal and heavy concrete, steel fibre concrete but also aerated concrete, much is on the to-do list before construction can begin.
Who builds the home asks himself so many questions such as “What do you understand by the term humidity?” or “How dangerous is heavy rain?” Construction phases there are really many for developers to consider such as smart home, photovoltaic and submission plan. What is the optimal start date for the construction site?…
Current
Forecast: 12 hours
Forecast: Tomorrow
Wind in Germany: Current
Wind in Germany: Tomorrow
Wind gusts
Summation of all winds
Rain for Hanover
Cloud formation: Today
Cloud formation: Tomorrow
Rainfall: Today
Rainfall: Tomorrow
Rainfall in Germany: Today
Rainfall in Germany: Tomorrow
Humidity: Today
Weather alerts
Thunderstorms: Today
Fine dust and CO2
CO content in Hanover
CO content (fine dust) in Germany
Statistics & Average
Temperature (°C)
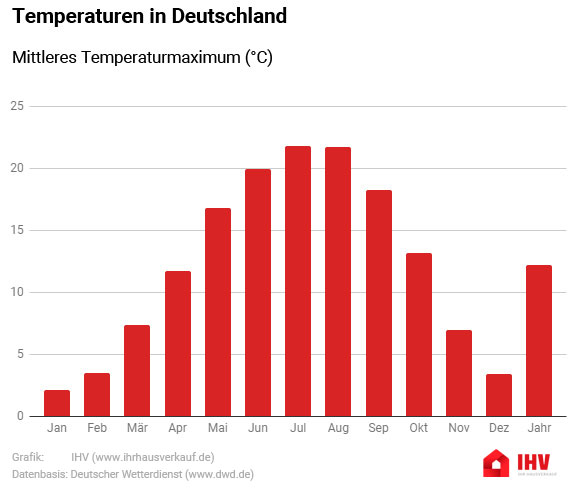
Mean maximum temperature (°C)
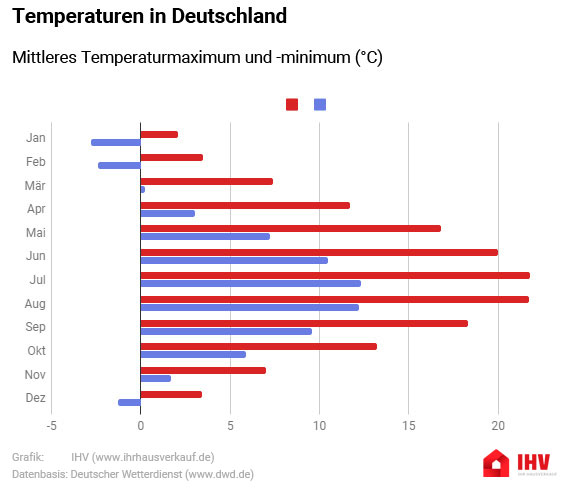
| Jan | Feb | Mar | Apr | May | Jun | Jul | Aug | Sep | Oct | Nov | Dec | Year |
| 2,1 | 3,5 | 7,4 | 11,7 | 16,8 | 20 | 21,8 | 21,7 | 18,3 | 13,2 | 7 | 3,4 | 12,2 |
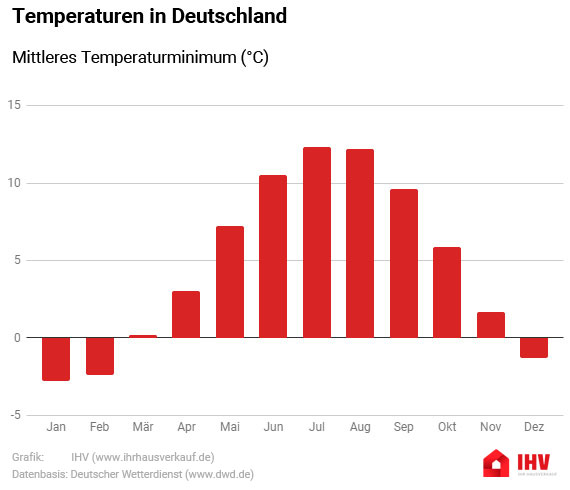
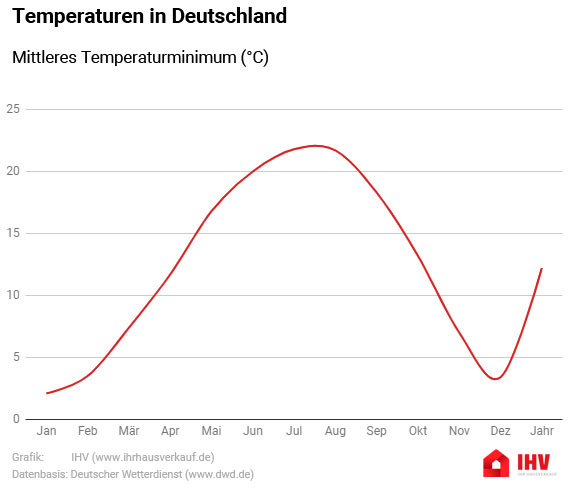
Mean minimum temperature (°C)
| Jan | Feb | Mar | Apr | May | Jun | Jul | Aug | Sep | Oct | Nov | Dec | Year |
| -2,8 | -2,4 | 0,2 | 3 | 7,2 | 10,5 | 12,3 | 12,2 | 9,6 | 5,9 | 1,7 | -1,3 | 4,7 |
Comparison of mean maximum and minimum temperatures (°C)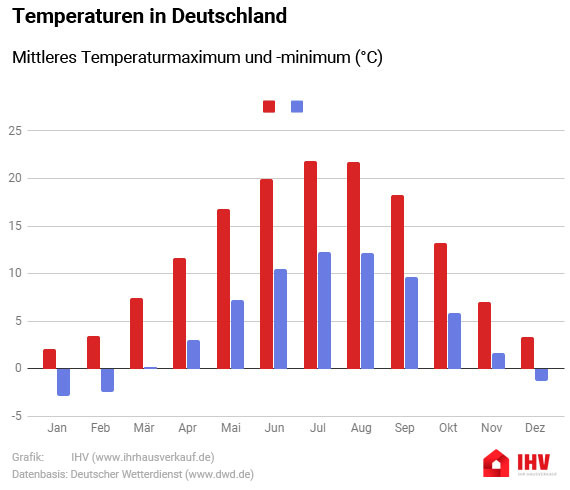
Rain
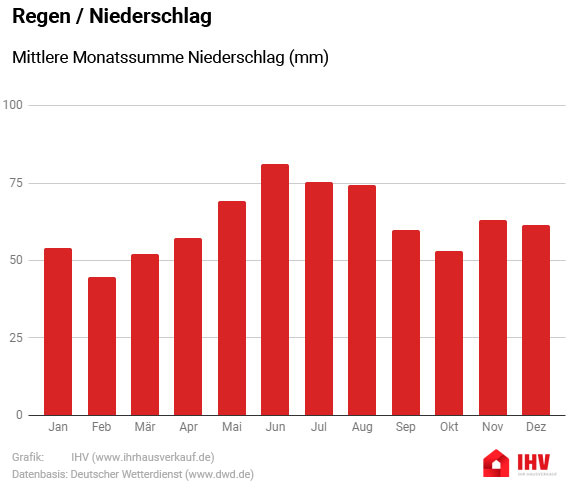
Mean monthly precipitation (mm)
| Jan | Feb | Mar | Apr | May | Jun | Jul | Aug | Sep | Oct | Nov | Dec | Year |
| 54,1 | 44,6 | 52,1 | 57,4 | 69,2 | 81,3 | 75,2 | 74,3 | 59,8 | 53 | 63,2 | 61,4 | 746,2 |
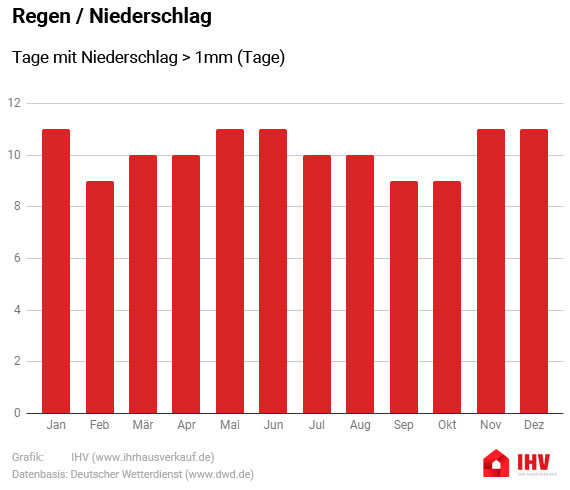
Days with precipitation > 1mm (days)
| Jan | Feb | Mar | Apr | May | Jun | Jul | Aug | Sep | Oct | Nov | Dec | Year |
| 11 | 9 | 10 | 10 | 11 | 11 | 10 | 10 | 9 | 9 | 11 | 11 | 121 |
Sunshine
Mean daily sum sun (h)
| Jan | Feb | Mar | Apr | May | Jun | Jul | Aug | Sep | Oct | Nov | Dec | Year |
| 1,6 | 2,7 | 3,8 | 5,3 | 6,8 | 7,1 | 7,1 | 6,7 | 5,2 | 3,7 | 2 | 1,4 | 4,5 |

Data basis: German Weather Service

