Millionaires & Billionaires: Private financial assets worldwide – infographics & statistics
Millionaires & billionaires – We show you how private financial assets are distributed. The USA is by far the leader when it comes to general assets, currently 74,370 billion euros. ~ 24 trillion more than China. But most millionaire households are located in Singapore (10.6%), Qatar (7.9%) and Switzerland (7.3%). We have all the facts and figures. Tip! How much do the richest entrepreneurs in the world earn? Here you can find the current daily rate of the 10 richest people in the world.
Assets by country and per capita
Before we take a look at the distribution of wealth in Europe and worldwide, here is the big question: In which countries do the largest assets exist?
- The richest countries
- Assets per capita
The richest countries
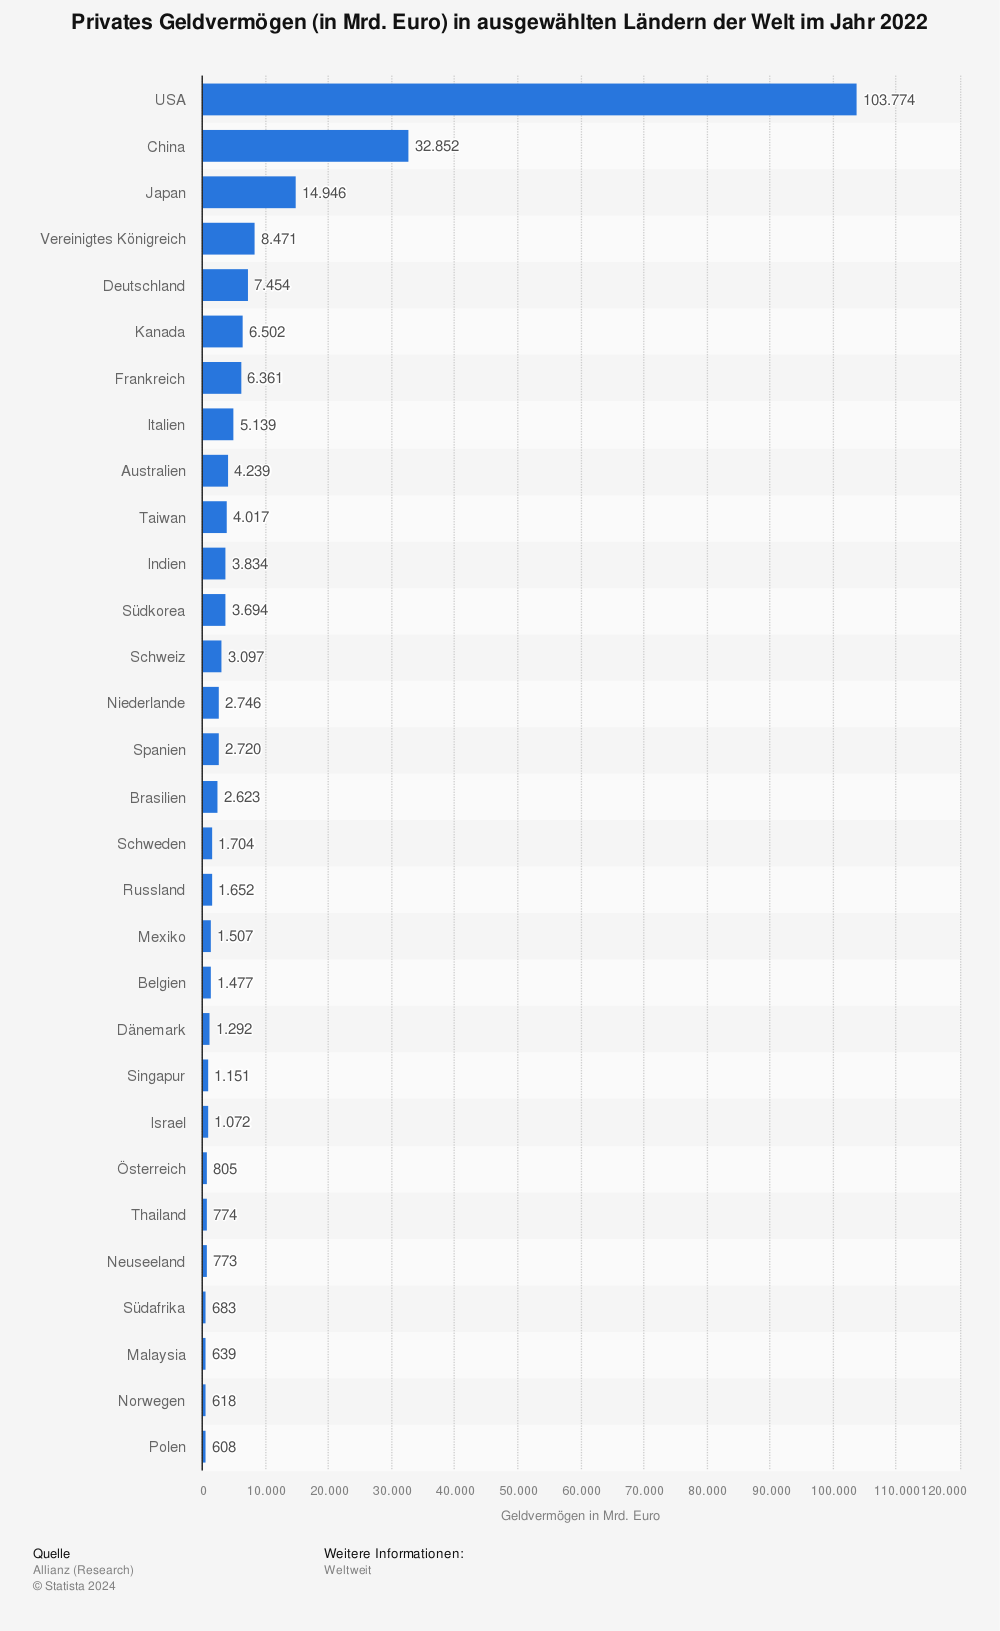
Here you can see the private financial assets (in billion euros) in selected countries of the world in 2018.
Top 10 richest countries
- USA – 74,370 billion
- China – 20,943 billion
- Japan – 15,054 billion
- United Kingdom – EUR 7,578 billion
- Germany – 6,202 billion Euro
- France – 5,413 billion euros
- Canada – 4,459 billion
- Italy – 4,163 billion euros
- Australia – 3,213 billion
- South Korea – 2,924 billion euros
More statistics can be found at Statista
Assets per capita
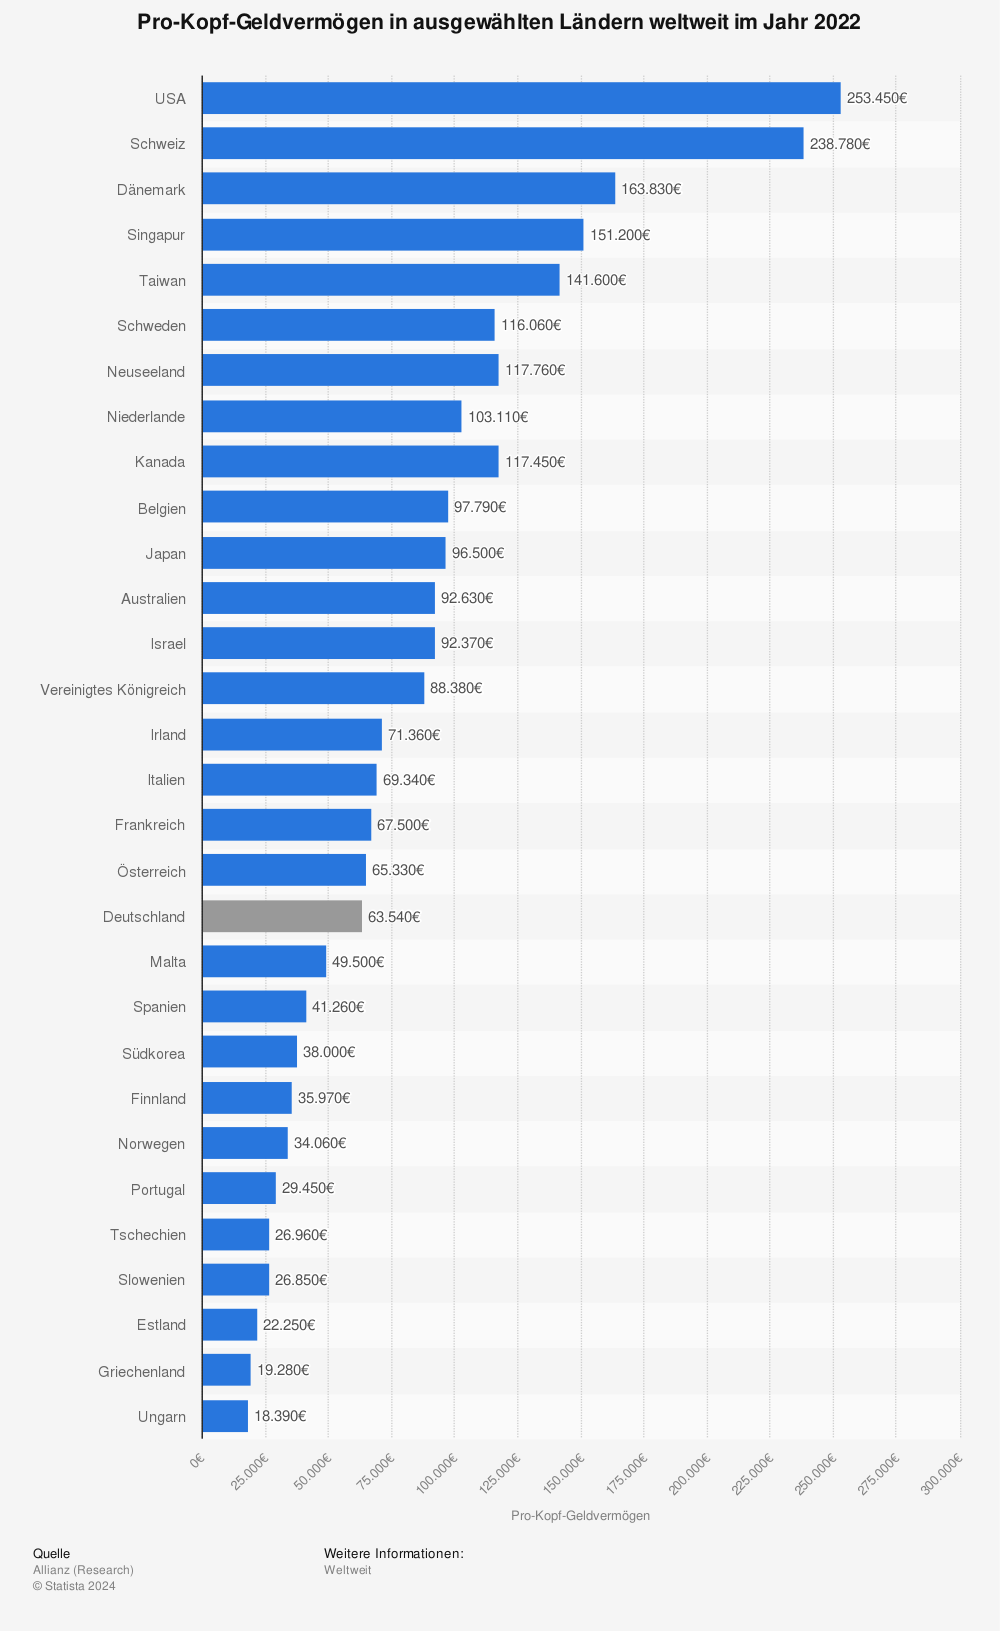
Here you can see the per capita financial assets in selected countries worldwide in 2018 (in euros)
Top 10 by assets per capita:
- USA – 184,411
- Switzerland – 173,838
- Singapore – 100,370
- Taiwan – 97,850
- Netherlands – 97,345
- Japan – 96,308
- Sweden 92,317
- Belgium – 89,543
- New Zealand – 87,621
- Denmark – 85,895
More statistics can be found at Statista
Assets worldwide
- Distribution of private financial assets
- Distribution of private financial assets – Europe
- Millionaire households in a global comparison
- Number of millionaires
- Millionaire’s assets
- Number of millionaires by region
- The most popular cities for the super rich
- The 25 richest people in the world
Distribution of private financial assets
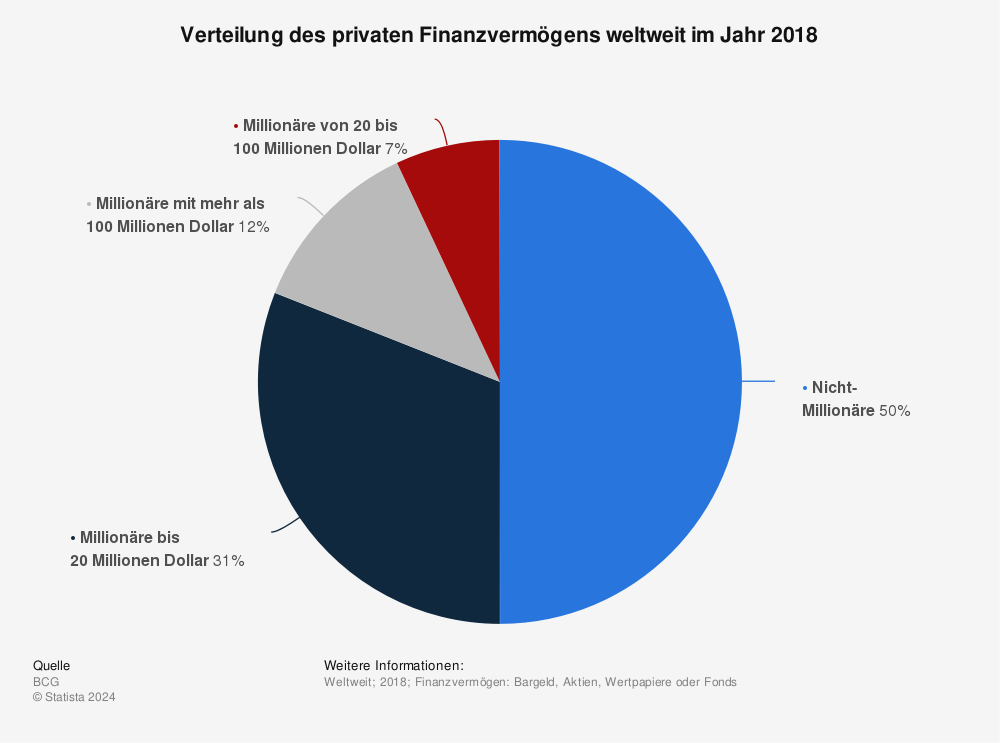
Distribution of private financial wealth worldwide in 2018.
- Millionaires with over $100 million – 7%
- Millionaires with $20 to $100 million – 12%
- Millionaires to $20 million – 31%
- Non-millionaires – 50%
More statistics can be found at Statista
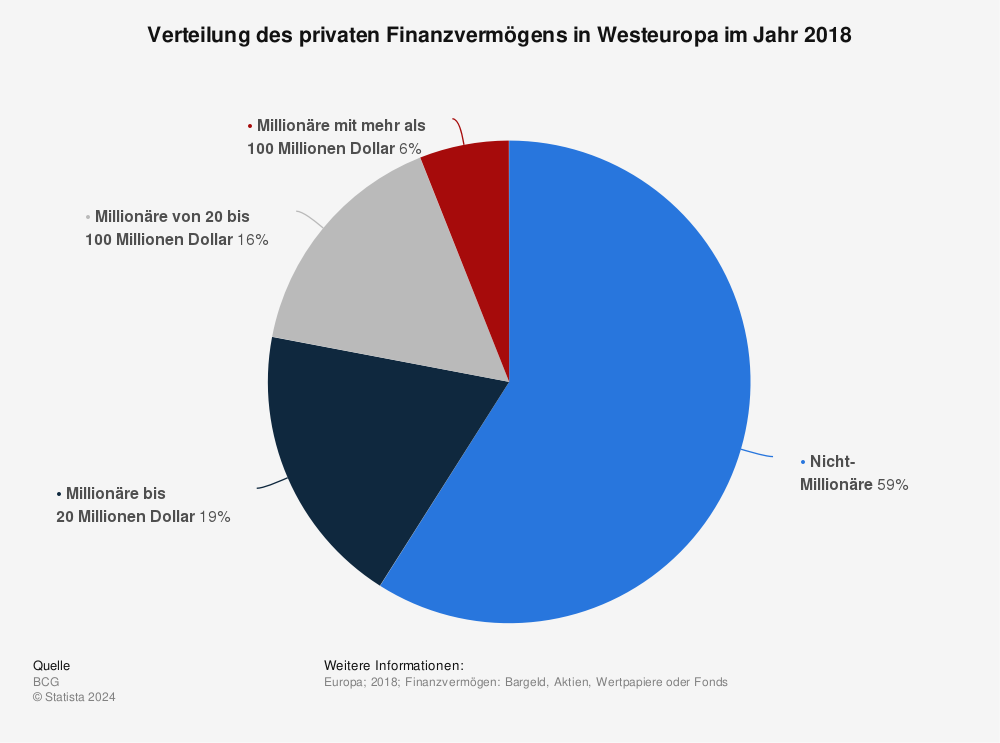
Distribution of private financial assets – Europe
Distribution of private financial assets in Western Europe in 2018.
- Millionaires with over $100 million – 6%
- Millionaires with $20 to $100 million – 16%
- Millionaires to $20 million – 19%
- Non-millionaires – 59%
More statistics can be found at Statista
Millionaire households in a global comparison
Countries with the highest proportion of millionaire households.
- Singapore – 10.6%
- Qatar – 7.9%
- Switzerland – 7.3%
- UAE – 6.6%
- Kuwait – 5.3%
- USA – 4.3%
- Belgium – 3.5%
- Israel – 3.4%
- Taiwan – 3.1%
- Great Britain – 2.6%

More statistics can be found at Statista
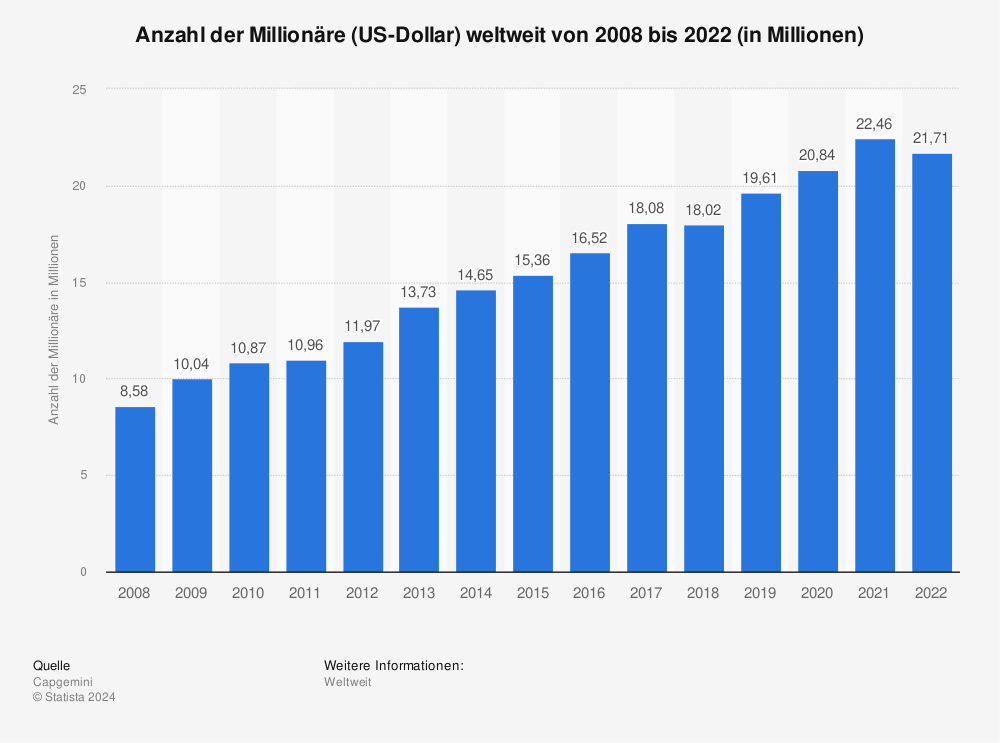
Number of millionaires
Number of millionaires worldwide from 2011 to 2018(in millions).
More statistics can be found at Statista
Millionaires’ assets
Assets of millionaires worldwide from 2011 to 2018 (in trillions of US dollars).
- 2011 – $42 trillion
- 2012 – $46.2 trillion
- 2013 – $52.6 trillion
- 2014 – $56.4 trillion
- 2015 – $58.7 trillion
- 2016 – $63.5 trillion
- 2017 – $70.2 trillion
- 2018 – $28.1 trillion

More statistics can be found at Statista
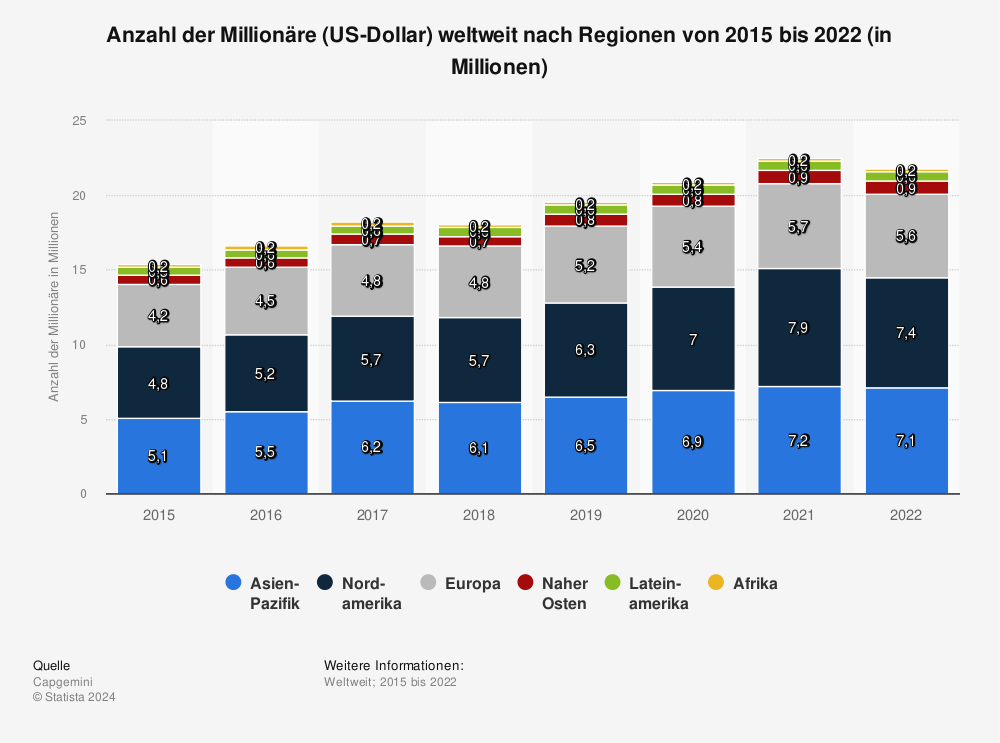
Number of millionaires by region
Number of millionaires worldwide by region from 2014 to 2018 (in millions).
More statistics can be found at Statista
The most popular cities for the super rich
The chart shows the number of super-rich people in cities around the world in 2018, with super-rich being anyone with net assets of more than $30 million.

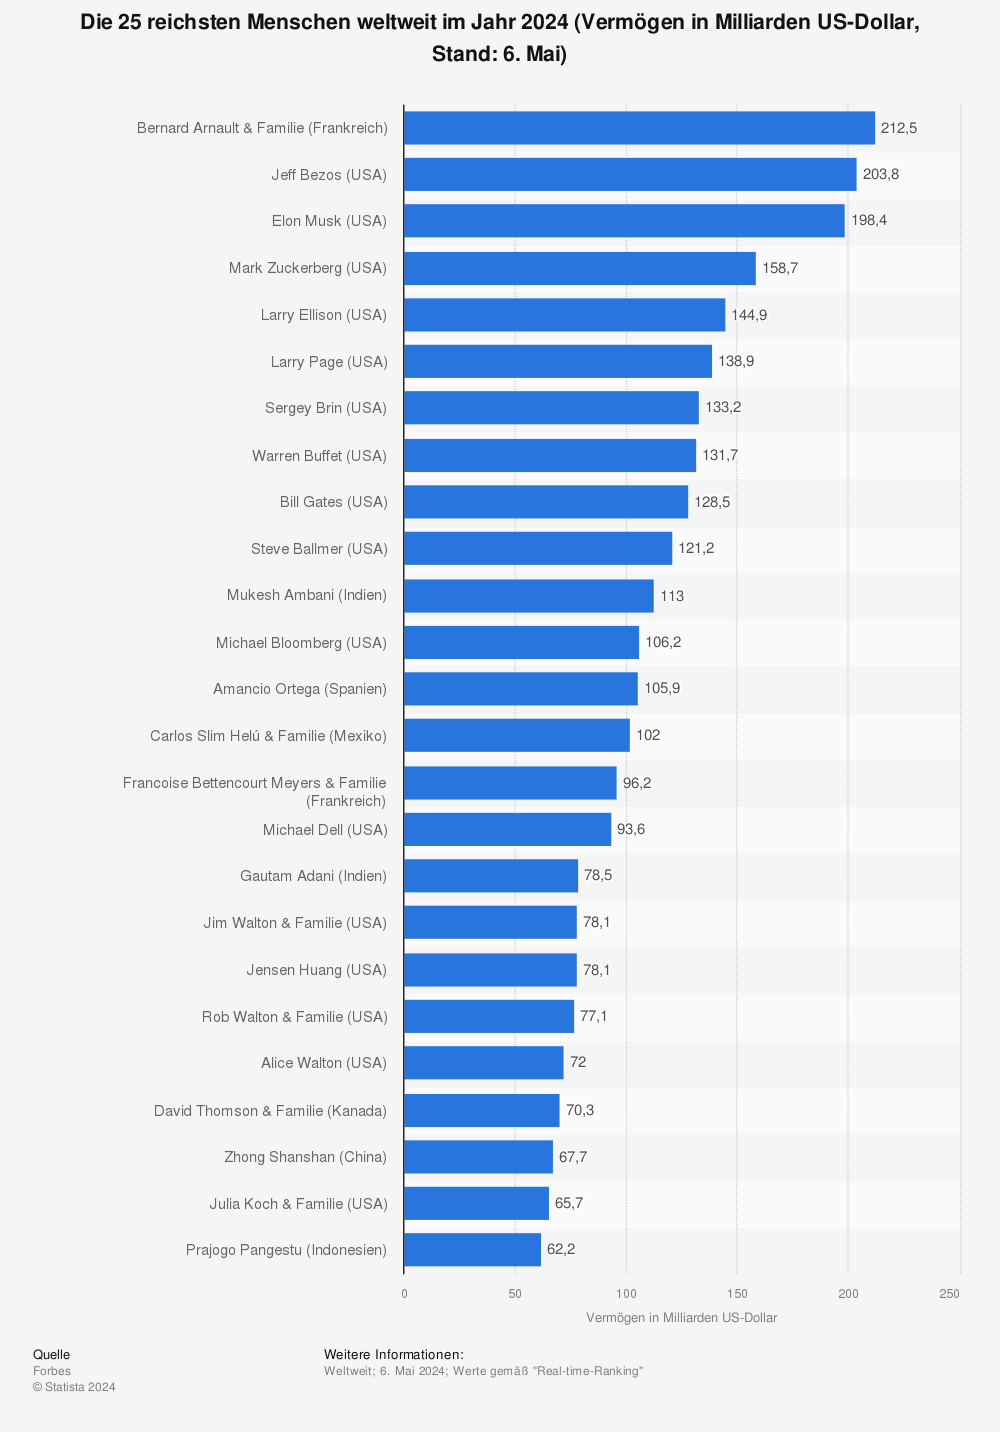
The 25 richest people
The 25 richest people in the world by wealth in 2020 (as of 17 February; in billions of US dollars). Read more here: The 25 richest people.
More statistics can be found at Statista
Luxury real estate
- Most expensive cities for luxury real estate
- That’s how much square footage you can get for $63,000.
- How much square footage can you get for $1 million?
Most expensive cities for luxury real estate
The chart shows the average purchase price per square meter of luxury properties in selected major cities worldwide.
 More statistics can be found at Statista
Such an area you get for $63,000
Living in luxury: This is how much m² you get for your money in the most popular cities for luxury properties, designer houses and loft apartments. As a basis for comparison, Monaco is the most expensive location, where you can get 1 square metre for $63,000. How much do you get for it in other top 9 cities?
- Monaco – 1 m²
- Hong Kong (China) – 1.4
- Aspen (USA) – 1.6
- St. Moritz (Switzerland) – 1.9
- New York (USA) – 2.0
- London (UK) – 2.0
- Singapore – 2.3
- Geneva (Switzerland) – 2.7
- Paris (France) – 2.9

Here we have another excellent infographics from the Federal Statistical Office, how many square meters are available for 1 million (or about 800,000 euros)? The chart shows the average size of premium properties at a price of 1 million US dollars in selected cities:
- Monaco – 16 m²
- Hong Kong – 22 m²
- New York – 25 m²
- London – 28 m²
- Paris – 46 m²
- Los Angeles – 58 square meters
- Tokyo – 77 square meters
- Berlin – 78 m²
- Miami – 78 m²
- Dubai – 98 m²
 More statistics can be found at Statista
Comparison values
- Rolex standard: Day-Date II
- 5-star hotel Overnight stay
Rolex standard: Day-Date II
The chart shows the price for a “Rolex Day-Date II” in selected cities worldwide.

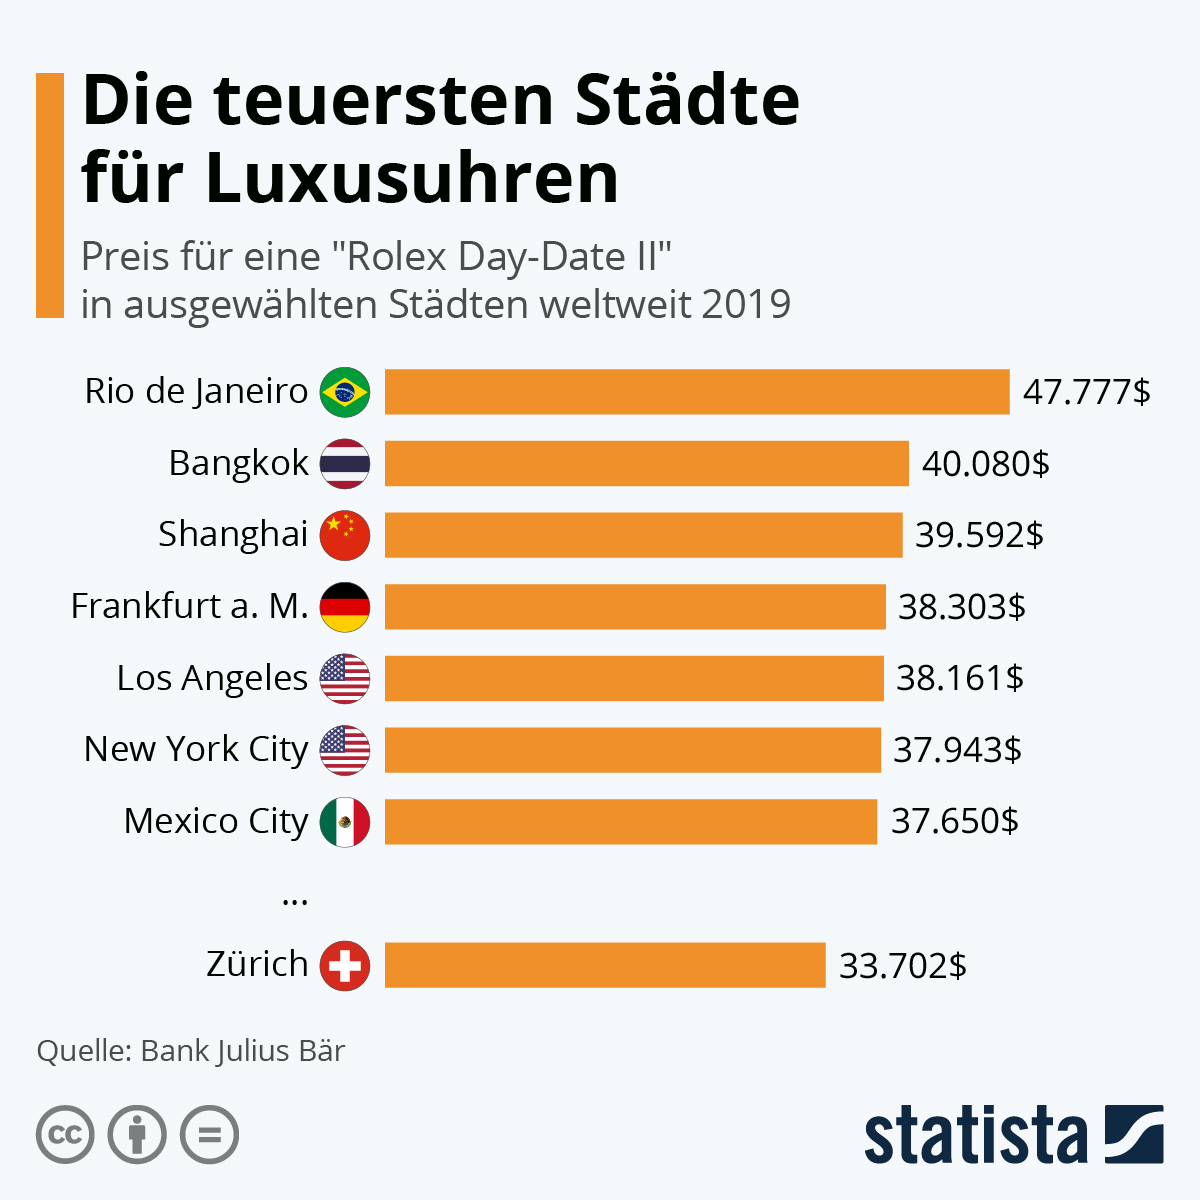 More statistics can be found at Statista
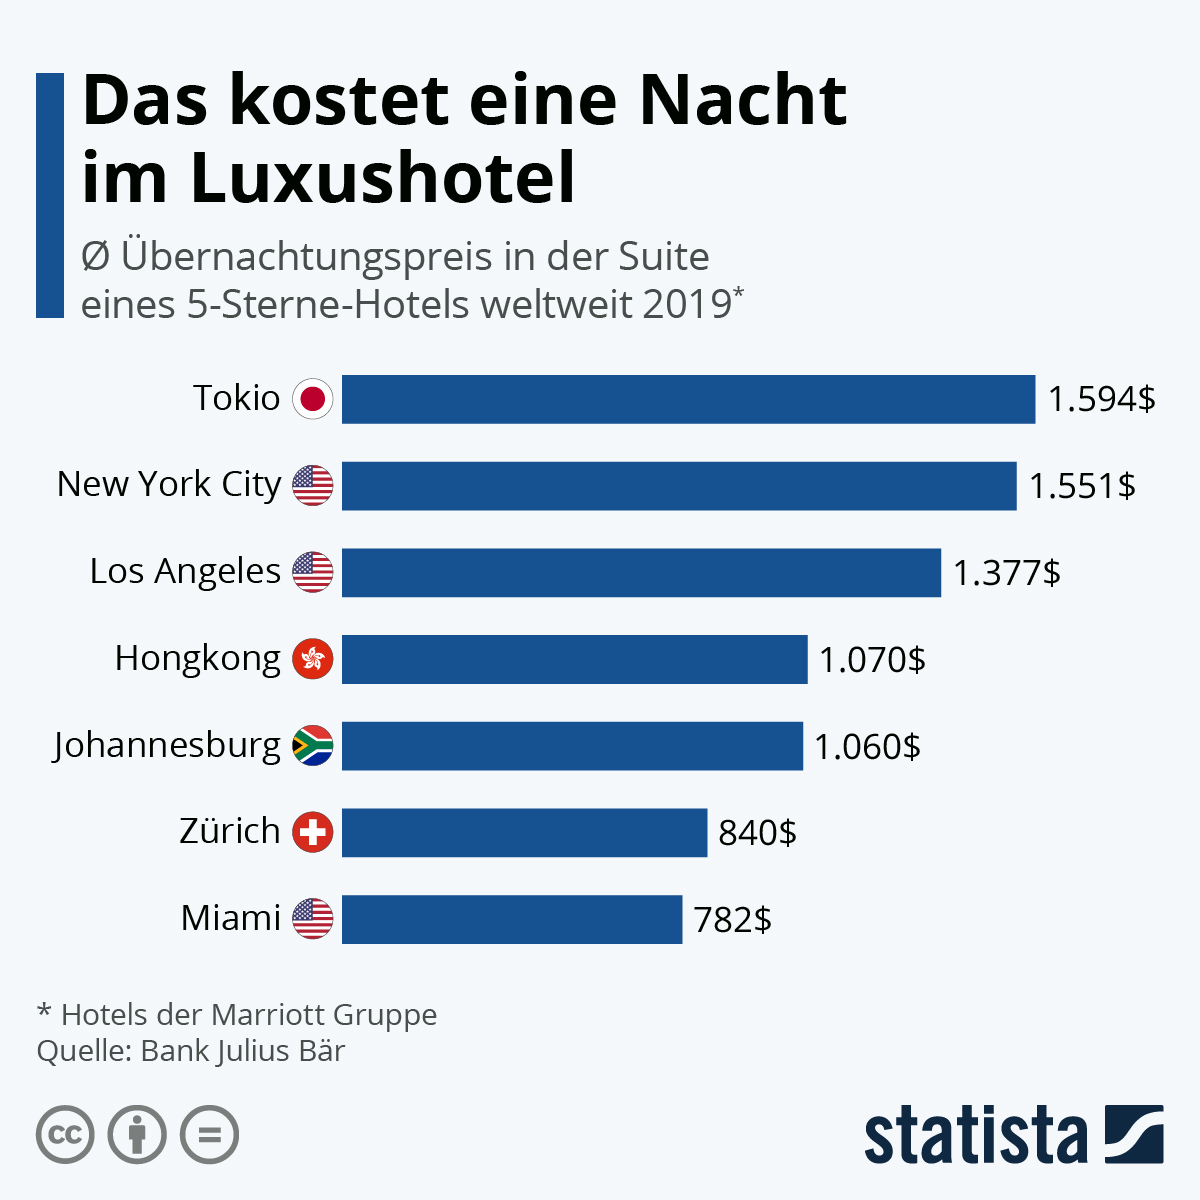
5 stars hotel accommodation
The chart shows the price of an overnight stay in the suite of a 5-star hotel in major cities worldwide.

