Weather in Mannheim: Humidity, thunderstorms, storm and sunshine hours
Weather Mannheim (7. September 2025) – construction sites weather in Mannheim. All relevant forecasts for the next few days for The Garage Door, Shower, Basement, The Kitchen to Cracks at a glance . More about the weather in Germany.
Temperatures in Mannheim
Current
Current temperatures in Mannheim on 7. September 2025.
Forecast: Today / 3 days
Current in Germany
Forecast for Mannheim: 12 hours
Wind in Mannheim
Unusual fluctuations in temperature but also rain affect the construction of the home. Wind or even hail, many weather factors affect the completion of newly built properties. Building materials, in addition to weather forecasts, are also the focus of builders such as binders or even elastomers (plastics) such as rubber, polyurethane (PUR) and acrylic. Many things have to be considered by builders before the start of construction and must always be kept in mind, such as wine cellars, siliconizing, rubber flooring, wooden flooring or even damp walls. Answers are sought to understandable questions such as “When do you talk about a hurricane?” but also “Can you hear lightning?” What is the optimal start for the planned construction site?.
Current
Forecast: 12 hours
Forecast: Tomorrow
Wind in Germany: Current
Wind in Germany: Tomorrow
Wind gusts
Summation of all winds
Rain for Mannheim
Cloud formation: Today
Cloud formation: Tomorrow
Rainfall: Today
Rainfall: Tomorrow
Rainfall in Germany: Today
Rainfall in Germany: Tomorrow
Humidity: Today
Weather alerts
Thunderstorms: Today
Fine dust and CO2
CO content in Mannheim
CO content (fine dust) in Germany
Statistics & Average
Temperature (°C)
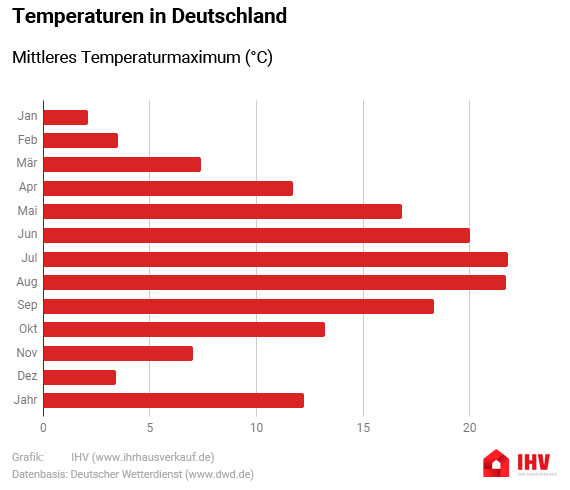
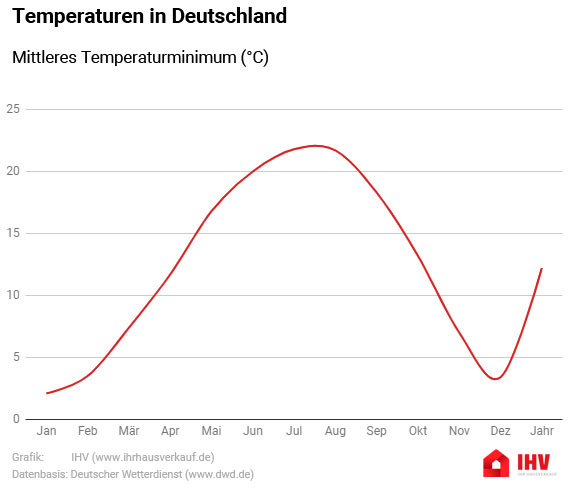
Mean maximum temperature (°C)
| Jan | Feb | Mar | Apr | May | Jun | Jul | Aug | Sep | Oct | Nov | Dec | Year |
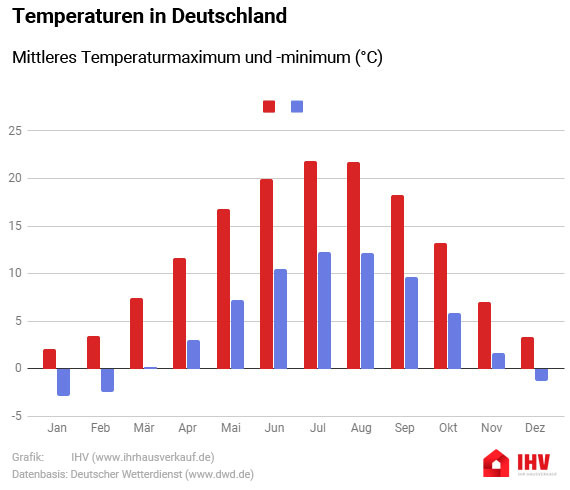
| 2,1 | 3,5 | 7,4 | 11,7 | 16,8 | 20 | 21,8 | 21,7 | 18,3 | 13,2 | 7 | 3,4 | 12,2 |
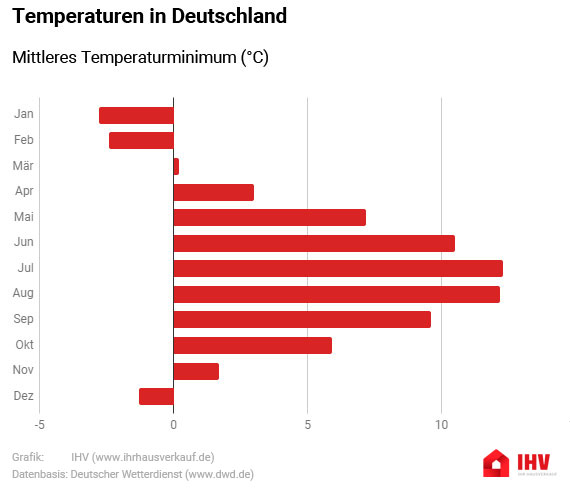
Mean minimum temperature (°C)
| Jan | Feb | Mar | Apr | May | Jun | Jul | Aug | Sep | Oct | Nov | Dec | Year |
| -2,8 | -2,4 | 0,2 | 3 | 7,2 | 10,5 | 12,3 | 12,2 | 9,6 | 5,9 | 1,7 | -1,3 | 4,7 |
Comparison of mean maximum and minimum temperatures (°C)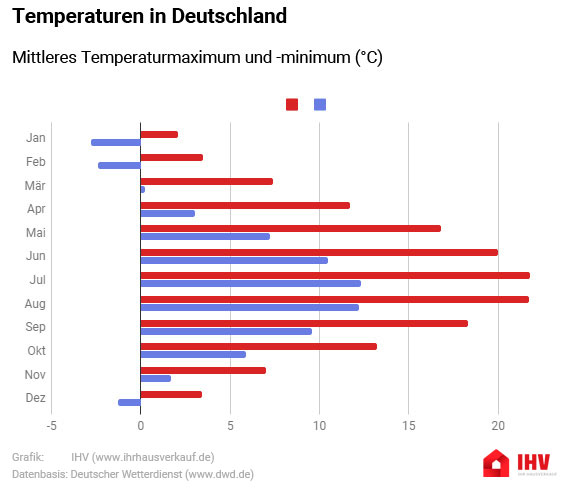
Rain
Mean monthly precipitation (mm)
| Jan | Feb | Mar | Apr | May | Jun | Jul | Aug | Sep | Oct | Nov | Dec | Year |
| 54,1 | 44,6 | 52,1 | 57,4 | 69,2 | 81,3 | 75,2 | 74,3 | 59,8 | 53 | 63,2 | 61,4 | 746,2 |
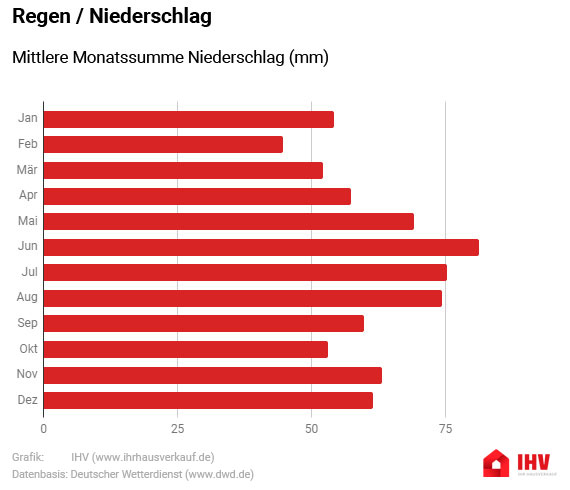
Days with precipitation > 1mm (days)
| Jan | Feb | Mar | Apr | May | Jun | Jul | Aug | Sep | Oct | Nov | Dec | Year |
| 11 | 9 | 10 | 10 | 11 | 11 | 10 | 10 | 9 | 9 | 11 | 11 | 121 |
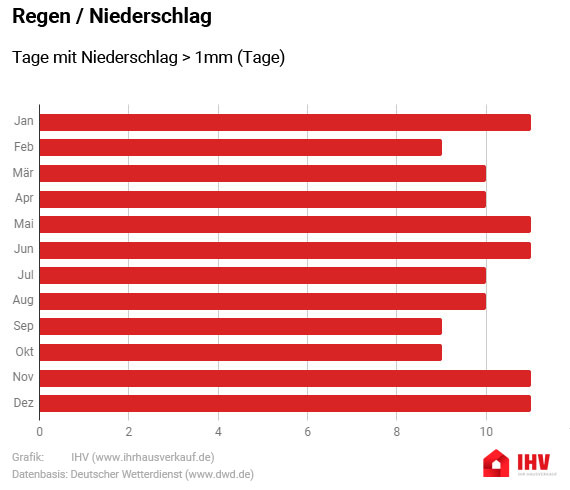
Sunshine
Mean daily sum sun (h)
| Jan | Feb | Mar | Apr | May | Jun | Jul | Aug | Sep | Oct | Nov | Dec | Year |
| 1,6 | 2,7 | 3,8 | 5,3 | 6,8 | 7,1 | 7,1 | 6,7 | 5,2 | 3,7 | 2 | 1,4 | 4,5 |

Data basis: German Weather Service
